
Coefficient of Variation: Meaning, Formula and Examples
As Standard Deviation is an absolute measure of dispersion, one cannot use it for comparing the variability of two or more series when they are expressed in different units. Therefore, in order to compare the variability of two or more series with different units it is essential to determine the relative measure of Standard Deviation. Two of the relative measures of Standard Deviation are Coefficient of Standard Deviation and Coefficient of Variation.
What is Coefficient of Variation?
It is a relative measure introduced by Karl Pearson (also known as Karl Pearson’s Coefficient of Variation) through which two or more groups of similar data are compared with respect to stability or homogeneity or consistency. It is the most appropriate measure and indicates the relationship between the standard deviation and the arithmetic mean of the given distributions/series. Coefficient of Variation is expressed in terms of percentage and can be determined using the following formula:
Where,
C.V. = Coefficient of Variation
σ = Standard Deviation
 = Arithmetic Mean
In simple terms, the Coefficient of Variation is 100 times of Coefficient of Standard Deviation. The distribution/series for which the coefficient of variation is greater is more variable (less homogeneous, less consistent, less stable, or less uniform).
Example 1:
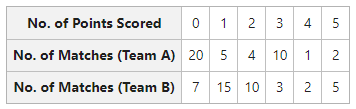
The number of points scored by two teams in a hockey match is given below. With the help of Coefficient of Variation, determine which team is more consistent.
Solution:
Coefficient of Variation (Team A):
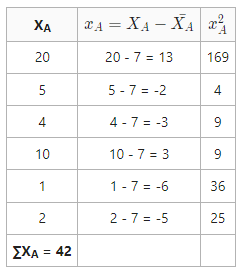


Coefficient of Variation (Team A) = 
C.V. (Team A) = 92.5%
Coefficient of Variation (Team B):
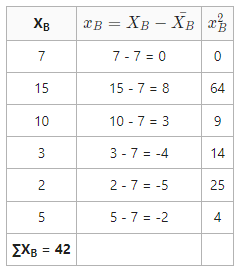


Coefficeint of Variation (Team B) = 
C.V. (Team B) = 62.7%
Coefficient of Team B is less, i.e., 62.7%, so Team B is more consistent.
Example 2:
Coefficient of Variation and Standard Deviation of two series X and Y are 55.43% and 48.86%, and 25.5 and 24.43, respectively. Find the means of series X and Y.
Solution:


Mean of Series X = 
Mean of Series Y = 
Mean of Series X = 46, Mean of Series Y = 50
As Standard Deviation is an absolute measure of dispersion, one cannot use it for comparing the variability of two or more series when they are expressed in different units. Therefore, in order to compare the variability of two or more series with different units it is essential to determine the relative measure of Standard Deviation. Two of the relative measures of Standard Deviation are Coefficient of Standard Deviation and Coefficient of Variation.
What is Coefficient of Variation?
It is a relative measure introduced by Karl Pearson (also known as Karl Pearson’s Coefficient of Variation) through which two or more groups of similar data are compared with respect to stability or homogeneity or consistency. It is the most appropriate measure and indicates the relationship between the standard deviation and the arithmetic mean of the given distributions/series. Coefficient of Variation is expressed in terms of percentage and can be determined using the following formula:
Where,
C.V. = Coefficient of Variation
σ = Standard Deviation
= Arithmetic Mean
In simple terms, the Coefficient of Variation is 100 times of Coefficient of Standard Deviation. The distribution/series for which the coefficient of variation is greater is more variable (less homogeneous, less consistent, less stable, or less uniform).
Example 1:
The number of points scored by two teams in a hockey match is given below. With the help of Coefficient of Variation, determine which team is more consistent.
Solution:
Coefficient of Variation (Team A):
Coefficient of Variation (Team A) =
C.V. (Team A) = 92.5%
Coefficient of Variation (Team B):
Coefficeint of Variation (Team B) =
C.V. (Team B) = 62.7%
Coefficient of Team B is less, i.e., 62.7%, so Team B is more consistent.
Example 2:
Coefficient of Variation and Standard Deviation of two series X and Y are 55.43% and 48.86%, and 25.5 and 24.43, respectively. Find the means of series X and Y.
Solution:
Mean of Series X =
Mean of Series Y =
Mean of Series X = 46, Mean of Series Y = 50
Denial of responsibility! Techno Blender is an automatic aggregator of the all world’s media. In each content, the hyperlink to the primary source is specified. All trademarks belong to their rightful owners, all materials to their authors. If you are the owner of the content and do not want us to publish your materials, please contact us by email – [email protected]. The content will be deleted within 24 hours.