
How to Perform Exploratory Data Analysis in QGis | by Angelica Lo Duca | May, 2022
Geographical data, Exploratory Data Analysis
A tutorial on how to use QGis to perform EDA of geographical data which is provided as CSV.
A data scientist may have to deal with geographic data. In this case, in addition to the classic methods of data exploration, you can also use specific tools for managing geographic data.
In this article, I describe how to use QGis to perform a preliminary exploration of a geographic dataset. As an example, I use the dataset relating to the mobility of taxi drivers, available at this link and released by [1,2].
The article is organized as follows:
- Installing and configuring QGis
- Loading the T-Drive dataset
- Performing EDA in QGis.
QGis is a very popular open-source tool to deal with geographical data. You can download it, from its official Web site, and follow the procedure to install it. Please, notice that the installation requires about 1GB of free space on your hard disk.
Once installed, you can launch it. You should see a window like the one shown in the following figure:

Now, you can enable the Quick Map Services plugin, which permits you to visualize data on a map. Click on the Plugins menu → Manage and Install Plugins. In the search bar, write QuickMapServices, and click to install it.
Once installed, you can access it under the Web menu → QuickMapServices, as shown in the following figure:

For example, you can select the Open Street Map (OSM) → OSM Standard. A map should appear in the central part of the QGis window:

You can zoom the image through the classical zoom buttons, as shown below:

You can change the current geographical coordinates of the system, by clicking on the button at the bottom right part of the screen, as shown in the following figure:

Once you click on it, a window opens, that permits you to select the system. If your dataset contains geographical coordinates in terms of latitude and longitude, you should select WGS 84 EPSG:4326.
The T-Drive dataset contains one-week trajectories of about 10K taxis. The total number of points in this dataset is about 15 million. In this example, I use an extract of this dataset, with about 1M of points. I have extracted the samples provided at this link: from part 6 to part 14. As a result, I have downloaded 551 files, related to 551 taxis.
As a preliminary step, I merge the 551 files to build a single CSV file, that I will use as an input to QGis. To merge the files I use the Python Pandas library.
Firstly, I load the required libraries:
import pandas as pd
import glob
import os
I will use the glob and os libraries to retrieve the list of files to merge. I put all the files to merge in a directory named source.
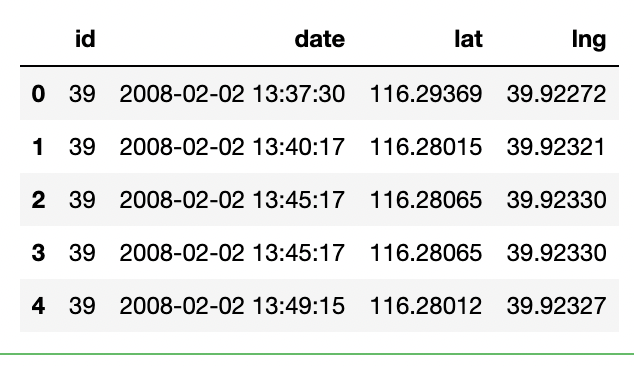
I load a sample dataset, to see its structure. Since the dataset does not contain any header, I also set the header:
df = pd.read_csv('source/39.txt', names=['id', 'date', 'lat', 'lng'])
df.head()
I retrieve the list of files in the source directory:
files = os.path.join("source/", "*.txt")
files = glob.glob(files)
Now, I read every file, and I append it to a list:
li = []
for file in files:
df = pd.read_csv(file, index_col=None, names=['id', 'date', 'lat', 'lng'])
li.append(df)
I concatenate all the files in the list to build a single Pandas Dataframe:
df = pd.concat(li, axis=0, ignore_index=True)
The Dataframe contains 985,972 rows. I save it to a file:
df.to_csv('source/merged.csv')
The dataset is ready to be imported into QGis!
To load the dataset in QGis, I select the Layer menu, then Add Layer → Add Delimited Text Layer. A window opens. Under the File Name text input, I select the merged.csv file.
Under the Geometry Definition, I select the X field (latitude) and Y field (longitude). I also make sure that the Geometry CRS is EPSG-4326 WG84.
I click Add → Close.
You should see the points on the map, as shown in the following figure:

The figure shows that there are many errors! The dataset should contain points in Beijing, but there are some points in Africa and others in Europe, and other places outside Beijing. For a hypothetical analysis, I should remove those points.
I perform the following operations on the map:
- showing taxis by color
- showing a single taxi.
3.1 Showing taxis by color
On the left part of the window, there is a list of loaded layers. I right-click on merged, and select Properties. Under the Symbology menu, I click on Single Symbol and then Categorized. In the value text input, I select id. Then, I click on the Classify button →Apply →OK.
If I zoom the map, I should see something similar to the following figure:

If I further zoom the map, I should see the taxis distributed across the roads:

3.2 Showing a single taxi
I right-click on the merged Layer, and I select Filter. A window opens, I select id = 2034 and then Test, to check whether there is any result or not. I click on ok.
If I change the zoom & pan level of the map, I should see the points:

I could add a label to every point, by right-clicking on the merged layer and selecting Properties →Labels →No Labels →Single Label →Value. I select the Date field, to see the date as a label. Then I click on Apply →OK.
Now I see the date near each point:

By adding another filter, I could continue the analysis that groups points by date. In this case, I should update the labels section, as previously described. Instead of id, I should select a date.
Congratulations! You have just learned some basic concepts on how to get started with QGis and use it to perform a very preliminary exploratory data analysis for geographical data.
QGis is very powerful, so you just have to test it and try other features!
If you have read this far, for me it is already a lot for today. Thanks! You can read my trending articles at this link.
[1] Jing Yuan, Yu Zheng, Xing Xie, and Guangzhong Sun. Driving with knowledge from the physical world. In The 17th ACM SIGKDD international conference on Knowledge Discovery and Data mining, KDD’11, New York, NY, USA, 2011. ACM.
[2] Jing Yuan, Yu Zheng, Chengyang Zhang, Wenlei Xie, Xing Xie, Guangzhong Sun, and Yan Huang. T-drive: driving directions based on taxi trajectories. In Proceedings of the 18th SIGSPATIAL International Conference on Advances in Geographic Information Systems, GIS ’10, pages 99–108, New York, NY, USA,2010. ACM.
Read this article.
Geographical data, Exploratory Data Analysis
A tutorial on how to use QGis to perform EDA of geographical data which is provided as CSV.
A data scientist may have to deal with geographic data. In this case, in addition to the classic methods of data exploration, you can also use specific tools for managing geographic data.
In this article, I describe how to use QGis to perform a preliminary exploration of a geographic dataset. As an example, I use the dataset relating to the mobility of taxi drivers, available at this link and released by [1,2].
The article is organized as follows:
- Installing and configuring QGis
- Loading the T-Drive dataset
- Performing EDA in QGis.
QGis is a very popular open-source tool to deal with geographical data. You can download it, from its official Web site, and follow the procedure to install it. Please, notice that the installation requires about 1GB of free space on your hard disk.
Once installed, you can launch it. You should see a window like the one shown in the following figure:
Now, you can enable the Quick Map Services plugin, which permits you to visualize data on a map. Click on the Plugins menu → Manage and Install Plugins. In the search bar, write QuickMapServices, and click to install it.
Once installed, you can access it under the Web menu → QuickMapServices, as shown in the following figure:
For example, you can select the Open Street Map (OSM) → OSM Standard. A map should appear in the central part of the QGis window:
You can zoom the image through the classical zoom buttons, as shown below:
You can change the current geographical coordinates of the system, by clicking on the button at the bottom right part of the screen, as shown in the following figure:
Once you click on it, a window opens, that permits you to select the system. If your dataset contains geographical coordinates in terms of latitude and longitude, you should select WGS 84 EPSG:4326.
The T-Drive dataset contains one-week trajectories of about 10K taxis. The total number of points in this dataset is about 15 million. In this example, I use an extract of this dataset, with about 1M of points. I have extracted the samples provided at this link: from part 6 to part 14. As a result, I have downloaded 551 files, related to 551 taxis.
As a preliminary step, I merge the 551 files to build a single CSV file, that I will use as an input to QGis. To merge the files I use the Python Pandas library.
Firstly, I load the required libraries:
import pandas as pd
import glob
import os
I will use the glob and os libraries to retrieve the list of files to merge. I put all the files to merge in a directory named source.
I load a sample dataset, to see its structure. Since the dataset does not contain any header, I also set the header:
df = pd.read_csv('source/39.txt', names=['id', 'date', 'lat', 'lng'])
df.head()
I retrieve the list of files in the source directory:
files = os.path.join("source/", "*.txt")
files = glob.glob(files)
Now, I read every file, and I append it to a list:
li = []
for file in files:
df = pd.read_csv(file, index_col=None, names=['id', 'date', 'lat', 'lng'])
li.append(df)
I concatenate all the files in the list to build a single Pandas Dataframe:
df = pd.concat(li, axis=0, ignore_index=True)
The Dataframe contains 985,972 rows. I save it to a file:
df.to_csv('source/merged.csv')
The dataset is ready to be imported into QGis!
To load the dataset in QGis, I select the Layer menu, then Add Layer → Add Delimited Text Layer. A window opens. Under the File Name text input, I select the merged.csv file.
Under the Geometry Definition, I select the X field (latitude) and Y field (longitude). I also make sure that the Geometry CRS is EPSG-4326 WG84.
I click Add → Close.
You should see the points on the map, as shown in the following figure:
The figure shows that there are many errors! The dataset should contain points in Beijing, but there are some points in Africa and others in Europe, and other places outside Beijing. For a hypothetical analysis, I should remove those points.
I perform the following operations on the map:
- showing taxis by color
- showing a single taxi.
3.1 Showing taxis by color
On the left part of the window, there is a list of loaded layers. I right-click on merged, and select Properties. Under the Symbology menu, I click on Single Symbol and then Categorized. In the value text input, I select id. Then, I click on the Classify button →Apply →OK.
If I zoom the map, I should see something similar to the following figure:
If I further zoom the map, I should see the taxis distributed across the roads:
3.2 Showing a single taxi
I right-click on the merged Layer, and I select Filter. A window opens, I select id = 2034 and then Test, to check whether there is any result or not. I click on ok.
If I change the zoom & pan level of the map, I should see the points:
I could add a label to every point, by right-clicking on the merged layer and selecting Properties →Labels →No Labels →Single Label →Value. I select the Date field, to see the date as a label. Then I click on Apply →OK.
Now I see the date near each point:
By adding another filter, I could continue the analysis that groups points by date. In this case, I should update the labels section, as previously described. Instead of id, I should select a date.
Congratulations! You have just learned some basic concepts on how to get started with QGis and use it to perform a very preliminary exploratory data analysis for geographical data.
QGis is very powerful, so you just have to test it and try other features!
If you have read this far, for me it is already a lot for today. Thanks! You can read my trending articles at this link.
[1] Jing Yuan, Yu Zheng, Xing Xie, and Guangzhong Sun. Driving with knowledge from the physical world. In The 17th ACM SIGKDD international conference on Knowledge Discovery and Data mining, KDD’11, New York, NY, USA, 2011. ACM.
[2] Jing Yuan, Yu Zheng, Chengyang Zhang, Wenlei Xie, Xing Xie, Guangzhong Sun, and Yan Huang. T-drive: driving directions based on taxi trajectories. In Proceedings of the 18th SIGSPATIAL International Conference on Advances in Geographic Information Systems, GIS ’10, pages 99–108, New York, NY, USA,2010. ACM.
Read this article.
Denial of responsibility! Techno Blender is an automatic aggregator of the all world’s media. In each content, the hyperlink to the primary source is specified. All trademarks belong to their rightful owners, all materials to their authors. If you are the owner of the content and do not want us to publish your materials, please contact us by email – [email protected]. The content will be deleted within 24 hours.