
Range: Meaning, Coefficient of Range, Merits and Demerits
Range is the easiest to understand of all the measures of dispersion. The difference between the largest and smallest item in a distribution is called range. It can be written as:
Range (R) = Largest item (L) – Smallest item (S)
For example, If the marks of 5 students of class Xth are 10, 5, 8, 4, 7. After arranging the marks in ascending (or descending) order, the difference between the highest and lowest scores will be the range of marks. Therefore, the range in this case will be 10 – 4 = 6.
The range which is expressed in the units of measurement of the given data, is an absolute measure of dispersion. A larger range value indicates greater dispersion, while a smaller range value shows lesser dispersion. The range will have a value of 0 if all the items are the same, indicating that there is no dispersion between the items.
Range is an absolute dispersion measure, hence it cannot be used to compare the variability of two distributions given in different units. For instance, if the amount of dispersion is calculated in dollars, it cannot be compared to the amount calculated in feet. In such situations, there is a need for a relative measurement (the coefficient of range) that is independent of units of the measurement.
Coefficient of Range
The ratio of the difference between two extreme items (the largest and smallest) of the distribution to their sum is known as the Coefficient of Range. The coefficient of the range is a relative measure of dispersion. Symbolically, range can be expressed as:
Calculation of Range and Coefficient of Range
(I) Individual Series
Example:
The scores of 15 students are shown in the data below:

Calculate the range and coefficient of range.
Solution:
In ascending order, the scores are 21, 25, 28, 30, 31, 32, 35, 40, 42, 49, 50, 51, 55, 60, 65
For the given values of scores, the Largest Item (L) = 65 and the Smallest Item (S) = 21
Range = L- S
= 65 – 21
Range = 44


Coefficient of Range = 0.51
(II) Discrete Series
The values of the largest (L) and smallest (S) items in a discrete series should not be confused with the largest and smallest frequencies. They represent the largest and smallest values of the variable. Therefore, the range is determined without taking into account their frequencies by subtracting the smallest item from the largest item.
Example:
Find the range and coefficient of the range of the following distribution:
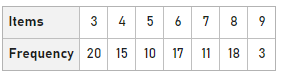
Solution:
Range (R) = Largest item (L) – Smallest item (S)
= 9-3
Range = 6


Coefficient of Range = 0.5
(III) Continuous Series
There are two ways to compute the range and coefficient of range for continuous frequency distributions:
1. First Method: Calculate the difference between the lower limits of the lowest-class interval and the upper limit of the highest-class.
2. Second Method: Calculate the difference between the mid-points of the lowest-class interval and the upper limit of the highest-class interval.
Note: Both methods will provide different results. However, both answers will be accurate.
Example:
Calculate the range and coefficient of range.
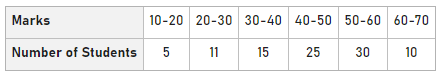
Solution:
Range and Coefficient of Range by the First Method:
Range (R) = Largest Item (L) – Smallest Item (S)
= 70 – 10
Range = 60


Coefficient of Range =0.75
Range and Coefficient of Range by the Second Method:
Range (R) = Mid-points of the Highest Class – Mid-points of the Lowest Class
= 65 – 15
Range = 50


Coefficient of Range = 0.625
Merits of Range
1. It is easy to understand and calculate.
2. It provides a quick measure of variability.
3. Range provides an overview of the data at once.
Demerits of Range
1. Range is not based on all of the observations. The range of distribution remains the same if every item is changed except for the smallest and largest item.
2. Fluctuations in sampling have a big impact on range. Its value differs widely between samples.
3. It does not provide any insight into the pattern of distribution. It is possible for two distributions to have the same range but different patterns of distribution.
Last Updated :
02 May, 2023
Like Article
Save Article
Range is the easiest to understand of all the measures of dispersion. The difference between the largest and smallest item in a distribution is called range. It can be written as:
Range (R) = Largest item (L) – Smallest item (S)
For example, If the marks of 5 students of class Xth are 10, 5, 8, 4, 7. After arranging the marks in ascending (or descending) order, the difference between the highest and lowest scores will be the range of marks. Therefore, the range in this case will be 10 – 4 = 6.
The range which is expressed in the units of measurement of the given data, is an absolute measure of dispersion. A larger range value indicates greater dispersion, while a smaller range value shows lesser dispersion. The range will have a value of 0 if all the items are the same, indicating that there is no dispersion between the items.
Range is an absolute dispersion measure, hence it cannot be used to compare the variability of two distributions given in different units. For instance, if the amount of dispersion is calculated in dollars, it cannot be compared to the amount calculated in feet. In such situations, there is a need for a relative measurement (the coefficient of range) that is independent of units of the measurement.
Coefficient of Range
The ratio of the difference between two extreme items (the largest and smallest) of the distribution to their sum is known as the Coefficient of Range. The coefficient of the range is a relative measure of dispersion. Symbolically, range can be expressed as:

Calculation of Range and Coefficient of Range
(I) Individual Series
Example:
The scores of 15 students are shown in the data below:
Calculate the range and coefficient of range.
Solution:
In ascending order, the scores are 21, 25, 28, 30, 31, 32, 35, 40, 42, 49, 50, 51, 55, 60, 65
For the given values of scores, the Largest Item (L) = 65 and the Smallest Item (S) = 21
Range = L- S
= 65 – 21
Range = 44
Coefficient of Range = 0.51
(II) Discrete Series
The values of the largest (L) and smallest (S) items in a discrete series should not be confused with the largest and smallest frequencies. They represent the largest and smallest values of the variable. Therefore, the range is determined without taking into account their frequencies by subtracting the smallest item from the largest item.
Example:
Find the range and coefficient of the range of the following distribution:
Solution:
Range (R) = Largest item (L) – Smallest item (S)
= 9-3
Range = 6
Coefficient of Range = 0.5
(III) Continuous Series
There are two ways to compute the range and coefficient of range for continuous frequency distributions:
1. First Method: Calculate the difference between the lower limits of the lowest-class interval and the upper limit of the highest-class.
2. Second Method: Calculate the difference between the mid-points of the lowest-class interval and the upper limit of the highest-class interval.
Note: Both methods will provide different results. However, both answers will be accurate.
Example:
Calculate the range and coefficient of range.
Solution:
Range and Coefficient of Range by the First Method:
Range (R) = Largest Item (L) – Smallest Item (S)
= 70 – 10
Range = 60
Coefficient of Range =0.75
Range and Coefficient of Range by the Second Method:
Range (R) = Mid-points of the Highest Class – Mid-points of the Lowest Class
= 65 – 15
Range = 50
Coefficient of Range = 0.625
Merits of Range
1. It is easy to understand and calculate.
2. It provides a quick measure of variability.
3. Range provides an overview of the data at once.
Demerits of Range
1. Range is not based on all of the observations. The range of distribution remains the same if every item is changed except for the smallest and largest item.
2. Fluctuations in sampling have a big impact on range. Its value differs widely between samples.
3. It does not provide any insight into the pattern of distribution. It is possible for two distributions to have the same range but different patterns of distribution.
Last Updated :
02 May, 2023
Like Article
Save Article
Denial of responsibility! Techno Blender is an automatic aggregator of the all world’s media. In each content, the hyperlink to the primary source is specified. All trademarks belong to their rightful owners, all materials to their authors. If you are the owner of the content and do not want us to publish your materials, please contact us by email – [email protected]. The content will be deleted within 24 hours.