
Relative Importance Analysis in R
A statistical method called relative importance analysis (RIA) is used to assess the relative contribution of independent variables to the variance of a dependent variable. It is used to evaluate the relative weights of predictor variables in a model. It enables us to recognize the predictors that are most crucial in illuminating the variation in the response variable. It provides an effective method for determining the primary causes of a phenomenon and is applicable to a number of disciplines, including marketing, finance, and social sciences. The many approaches to relative significance analysis in R Programming Language will be covered in this article.
The relative significance of independent variables can be determined using a variety of metrics, such as:
- Variable importance: The relative importance of each variable in a regression model in relation to the desired outcome is known as variable importance.
- Relative importance: A measure of each variable’s relevance in relation to the other variables in the model is called relative importance.
- Decomposition methods: To evaluate each variable’s relative relevance, decomposition techniques are employed to break down the variation that each variable in the model explains.
Variable Importance Plot
A graphical tool for assessing the relative weights of predictors in a model is the variable importance plot. The caret package’s varImp() function makes it simple to generate them. Here is a sample of the code:
R
|
|
Output:
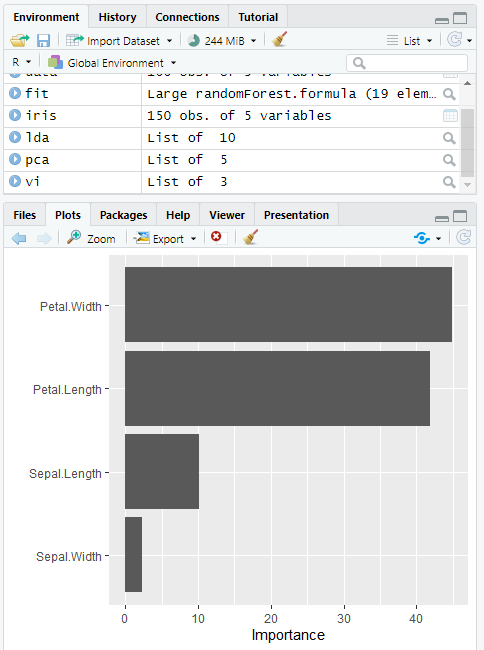
Variable Importance Plot
Using the varImp() and plot() methods, this code generates a variable importance plot after fitting a random forest model to the iris dataset.
Permutation Importance
Another way for assessing variable importance is permutation importance. It operates by varying a predictor variable’s values at random and observing the impact on the model’s performance. Permutation importance charts can be made using the vip() method from the vip package. Here is a sample of the code:
R
|
|
Output:
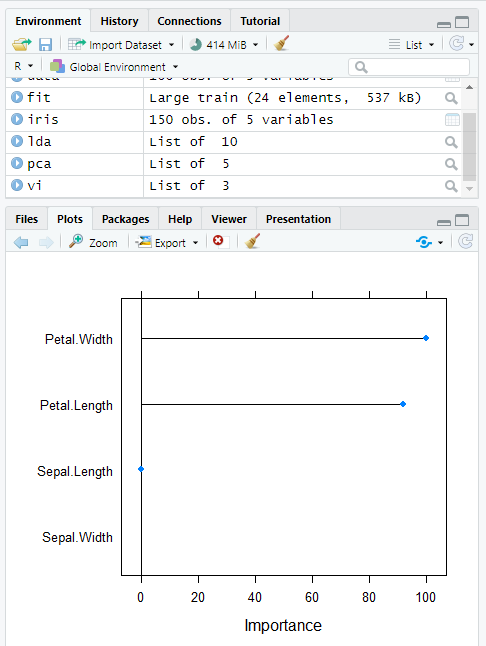
Permutation Importance
This code generates a permutation significance plot by utilizing the vip() function after fitting a random forest model to the iris dataset.
Relative Weight Analysis
Based on their standardized regression coefficients, a method called relative weight analysis can be used to evaluate the relative weights of the predictors in a model. For doing relative weight analysis, the relaimpo package offers the function calc.relimp(). Here’s an illustration of the code:
R
|
|
Output:
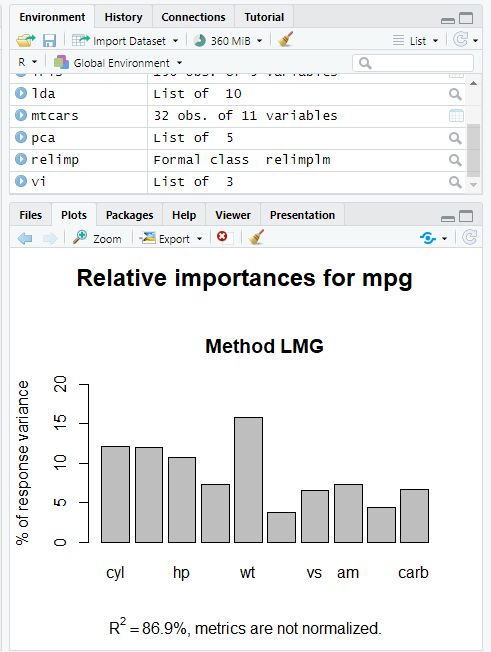
Relative Weight Analysis
This program analyses relative weights using the calc.relimp() function of the relaimpo package and fits a linear regression model to the mtcars dataset. A bar plot depicting the relative significance of the predictors is then produced.
Bootstrap Relative Importance
To determine the relative weights of predictor variables in a linear regression model using bootstrap resampling, use the R functions boot.relimp() and booteval.relimp().
Here, the type parameter is set to “lmg,” which stands for “Lindeman, Merenda, and Gold,” an often suggested approach for determining relative importance. The number of bootstrap samples to use is specified by the nboot option.
- The bootstrapped estimates of the relative importance of each predictor variable are contained in the boot rel object that boot.relimp() returns.
- The booteval.relimp() method can be used to compute confidence intervals for the relative significance estimations in addition to displaying the results.
The bootstrapped confidence intervals for the relative significance estimates are contained in the boot eval object that booteval.relimp() returned. With the plot() method, you can see the confidence intervals. The confidence intervals for each predictor variable will then be plotted.
R
|
|
Output:
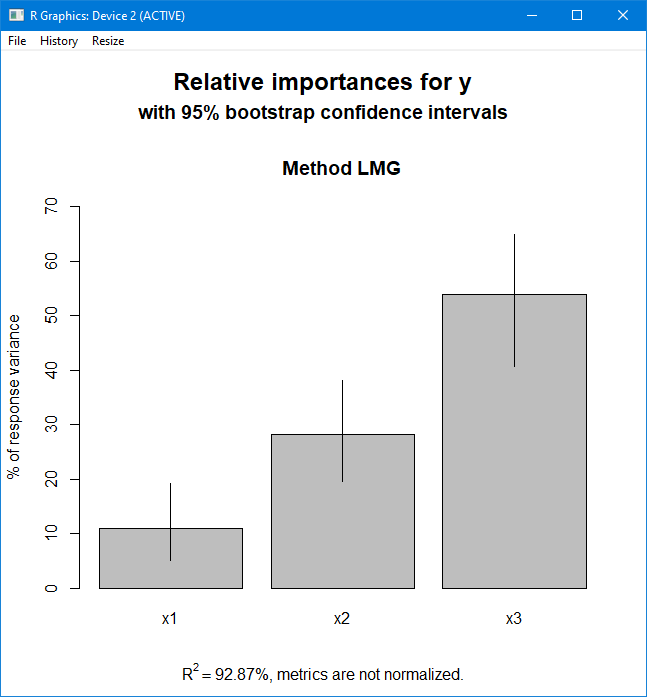
Bootstrap Relative Importance
Conclusion
In this post, we covered many approaches to relative significance analysis in R. We discussed relative weight analysis, variable importance charts, and permutation importance. We may make data-driven decisions and establish the relative importance of predictor variables in our models by comprehending and using these strategies.
Last Updated :
26 Jun, 2023
Like Article
Save Article
A statistical method called relative importance analysis (RIA) is used to assess the relative contribution of independent variables to the variance of a dependent variable. It is used to evaluate the relative weights of predictor variables in a model. It enables us to recognize the predictors that are most crucial in illuminating the variation in the response variable. It provides an effective method for determining the primary causes of a phenomenon and is applicable to a number of disciplines, including marketing, finance, and social sciences. The many approaches to relative significance analysis in R Programming Language will be covered in this article.
The relative significance of independent variables can be determined using a variety of metrics, such as:
- Variable importance: The relative importance of each variable in a regression model in relation to the desired outcome is known as variable importance.
- Relative importance: A measure of each variable’s relevance in relation to the other variables in the model is called relative importance.
- Decomposition methods: To evaluate each variable’s relative relevance, decomposition techniques are employed to break down the variation that each variable in the model explains.
Variable Importance Plot
A graphical tool for assessing the relative weights of predictors in a model is the variable importance plot. The caret package’s varImp() function makes it simple to generate them. Here is a sample of the code:
R
|
|
Output:
Variable Importance Plot
Using the varImp() and plot() methods, this code generates a variable importance plot after fitting a random forest model to the iris dataset.
Permutation Importance
Another way for assessing variable importance is permutation importance. It operates by varying a predictor variable’s values at random and observing the impact on the model’s performance. Permutation importance charts can be made using the vip() method from the vip package. Here is a sample of the code:
R
|
|
Output:
Permutation Importance
This code generates a permutation significance plot by utilizing the vip() function after fitting a random forest model to the iris dataset.
Relative Weight Analysis
Based on their standardized regression coefficients, a method called relative weight analysis can be used to evaluate the relative weights of the predictors in a model. For doing relative weight analysis, the relaimpo package offers the function calc.relimp(). Here’s an illustration of the code:
R
|
|
Output:
Relative Weight Analysis
This program analyses relative weights using the calc.relimp() function of the relaimpo package and fits a linear regression model to the mtcars dataset. A bar plot depicting the relative significance of the predictors is then produced.
Bootstrap Relative Importance
To determine the relative weights of predictor variables in a linear regression model using bootstrap resampling, use the R functions boot.relimp() and booteval.relimp().
Here, the type parameter is set to “lmg,” which stands for “Lindeman, Merenda, and Gold,” an often suggested approach for determining relative importance. The number of bootstrap samples to use is specified by the nboot option.
- The bootstrapped estimates of the relative importance of each predictor variable are contained in the boot rel object that boot.relimp() returns.
- The booteval.relimp() method can be used to compute confidence intervals for the relative significance estimations in addition to displaying the results.
The bootstrapped confidence intervals for the relative significance estimates are contained in the boot eval object that booteval.relimp() returned. With the plot() method, you can see the confidence intervals. The confidence intervals for each predictor variable will then be plotted.
R
|
|
Output:
Bootstrap Relative Importance
Conclusion
In this post, we covered many approaches to relative significance analysis in R. We discussed relative weight analysis, variable importance charts, and permutation importance. We may make data-driven decisions and establish the relative importance of predictor variables in our models by comprehending and using these strategies.
Last Updated :
26 Jun, 2023
Like Article
Save Article
Denial of responsibility! Techno Blender is an automatic aggregator of the all world’s media. In each content, the hyperlink to the primary source is specified. All trademarks belong to their rightful owners, all materials to their authors. If you are the owner of the content and do not want us to publish your materials, please contact us by email – [email protected]. The content will be deleted within 24 hours.