
Unlocking the Secrets of Thinning Ice Shelves
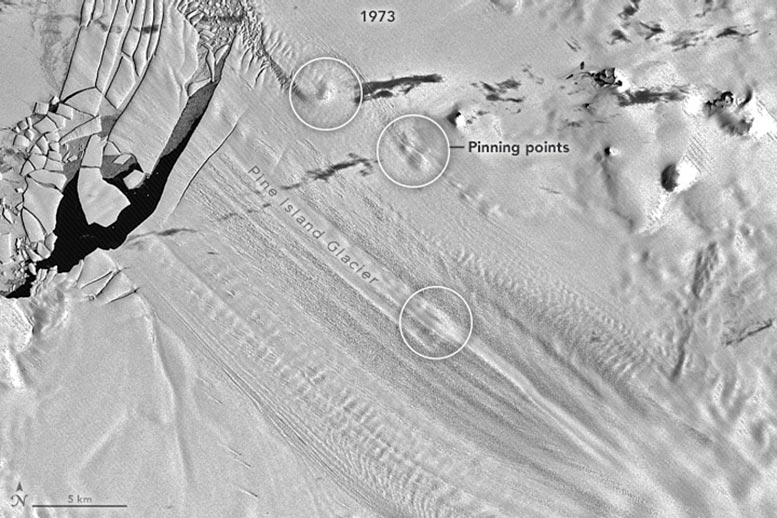
Satellite image of Pine Island Glacier captured on January 24, 1973, by the Multispectral Scanner on Landsat 1.
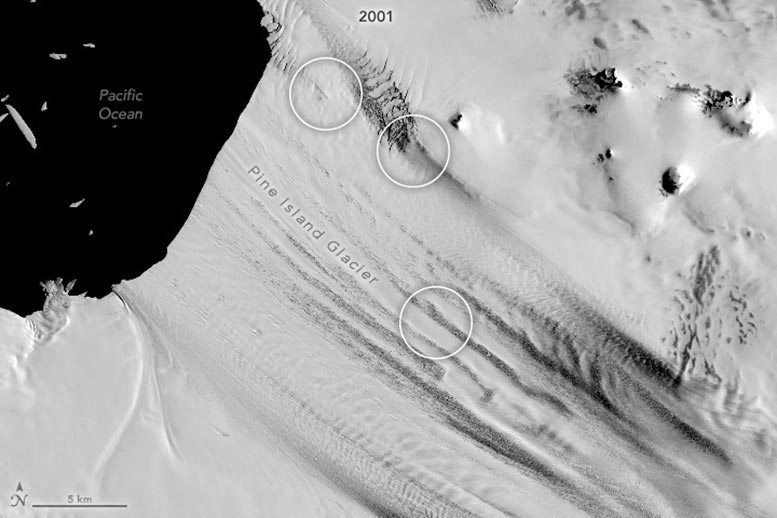
Satellite image of Pine Island Glacier captured on December 15, 2001, by the Enhanced Thematic Mapper Plus on Landsat 7.
New research shows that while some Antarctic ice shelves have been thinning since at least the 1970s, widespread thinning accelerated in the 1990s.
For many ice shelves around Antarctica, the 1970s was a bumpy decade. Fast forward, and satellite images show that many of the bumps once prominently visible on the surface of ice shelves have smoothed—implying that the shelves have become thinner and less stable.
The Role of Ice Shelves
An ice shelf is the extension of land-based ice—a tongue of a glacier that has stretched out from the coast and onto the surface of the ocean. Most of the planet’s ice shelves fringe Antarctica, where they play an important role in holding back, or buttressing, the flow of ice from inland and upstream. Such buttressing can slow the discharge of ice into the ocean and limit sea level rise. Thick, stable ice shelves perform this buttressing role most effectively.
Historical Perspective on Ice Shelf Thinning
Using satellite altimetry data collected since the 1990s, scientists previously found significant thinning on ice shelves in West Antarctica, the western Antarctic Peninsula, and parts of East Antarctica. Now Bertie Miles and Robert Bingham of the University of Edinburgh have looked even further back in time, using 50 years of imagery from Landsat satellites to extend our view of the changing continent.
Their research shows that the thinning underway between 1973 and 1989 was limited to small parts of ice shelves, mostly in the Amundsen Sea Embayment and the Wilkes Land coastline of East Antarctica. Then, from the 1990s onward, thinning spread rapidly. Their results were published on February 22 in Nature.
A Turning Point in the 1990s
The extended look back in time shows that the 1990s was a turning point. “While many previous studies have reported ongoing ice shelf thinning around Antarctica since the 1990s, we didn’t previously know that a lot of it started around then,” Bingham said.
Satellite altimetry data—measurement of the height of land and ice surfaces—was not available prior to the 1990s, so Miles and Bingham instead used optical images to track variations in the bumps on the ice surface. These bumps are surface expressions of pinning points—places where the floating ice shelf is anchored onto a high point of the seafloor. Pinning points are a useful indicator of ice shelf thickness: Bumps that become smaller or even smoothed out entirely over time indicate that an ice shelf had thinned and had possibly become unpinned.
“Bertie’s novel use of Landsat to map the unanchoring of pinning points serves as a proxy for ice shelf thickness change, alongside the more sophisticated altimetry methods the community has generally used,” Bingham said.
Pine Island Glacier: A Case Study
The image pair at the top of this page shows Pine Island Glacier, one of the regions in the Amundsen Sea Embayment where thinning was already underway in the 1970s. Several bumpy areas visible on the ice surface in January 1973 (upper) are mostly smooth in December 2001 (lower). Images were acquired with the MSS (Multispectral Scanner) on Landsat 1 (upper) and the ETM+ (Enhanced Thematic Mapper Plus) on Landsat 7 (lower). Note that the images use a grayscale palette to achieve a closer match between the different sensors.
“These images show the pinning points getting smaller through time as warm ocean currents melt the ice shelves, causing them to thin and subsequently unanchor from the seafloor highs,” Miles said.
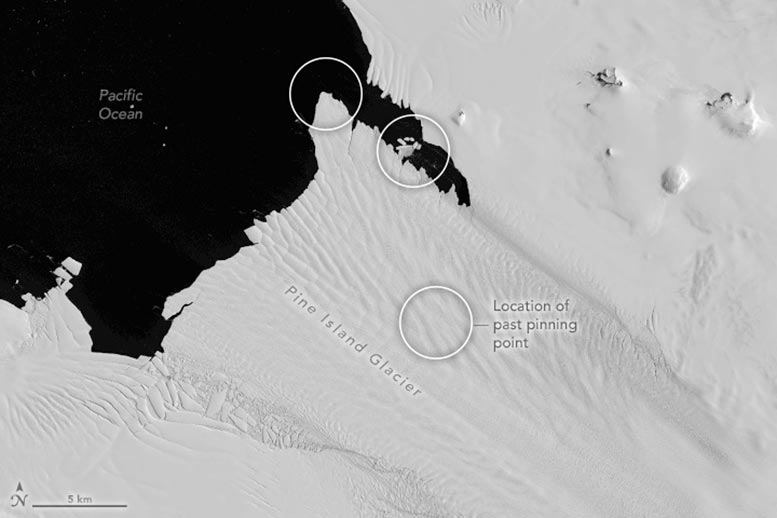
Satellite image of Pine Island Glacier’s ice shelf captured on January 20, 2024, by the Operational Land Imager-2 on Landsat 9.
Miles and Bingham’s findings confirmed that Pine Island Glacier was thinning sooner than most Antarctic ice shelves. Out of roughly 600 pinning points that the researchers tracked, only 15 percent shrank in size from 1973 to 1989, including those on Pine Island Glacier. That number grew to 25 percent between 1990 and 2000, and 37 percent between 2000 and 2022.
The image above, acquired with the OLI-2 (Operational Land Imager-2) on Landsat 9, shows Pine Island Glacier’s ice shelf in January 2024. By then, the smooth, thinning shelf had lost additional ice along its front and northern margin, and fractured ice was visible along the southern edge.
With Pine Island Glacier at or near the point of being completely unanchored, its ability to buttress ice has already been minimized. The “greater concern,” Miles and Bingham pointed out in their paper, might be the other major ice shelves that are still heavily anchored but showing signs of quickly losing their pinning points.
Reference: “Progressive unanchoring of Antarctic ice shelves since 1973” by Bertie W. J. Miles, and Robert G. Bingham, 21 February 2024, Nature.
DOI: 10.1038/s41586-024-07049-0
NASA Earth Observatory images by Wanmei Liang, using Landsat data from the U.S. Geological Survey and pinning point data from Miles, B.W.J., and Bingham, R.G.
Satellite image of Pine Island Glacier captured on January 24, 1973, by the Multispectral Scanner on Landsat 1.
Satellite image of Pine Island Glacier captured on December 15, 2001, by the Enhanced Thematic Mapper Plus on Landsat 7.
New research shows that while some Antarctic ice shelves have been thinning since at least the 1970s, widespread thinning accelerated in the 1990s.
For many ice shelves around Antarctica, the 1970s was a bumpy decade. Fast forward, and satellite images show that many of the bumps once prominently visible on the surface of ice shelves have smoothed—implying that the shelves have become thinner and less stable.
The Role of Ice Shelves
An ice shelf is the extension of land-based ice—a tongue of a glacier that has stretched out from the coast and onto the surface of the ocean. Most of the planet’s ice shelves fringe Antarctica, where they play an important role in holding back, or buttressing, the flow of ice from inland and upstream. Such buttressing can slow the discharge of ice into the ocean and limit sea level rise. Thick, stable ice shelves perform this buttressing role most effectively.
Historical Perspective on Ice Shelf Thinning
Using satellite altimetry data collected since the 1990s, scientists previously found significant thinning on ice shelves in West Antarctica, the western Antarctic Peninsula, and parts of East Antarctica. Now Bertie Miles and Robert Bingham of the University of Edinburgh have looked even further back in time, using 50 years of imagery from Landsat satellites to extend our view of the changing continent.
Their research shows that the thinning underway between 1973 and 1989 was limited to small parts of ice shelves, mostly in the Amundsen Sea Embayment and the Wilkes Land coastline of East Antarctica. Then, from the 1990s onward, thinning spread rapidly. Their results were published on February 22 in Nature.
A Turning Point in the 1990s
The extended look back in time shows that the 1990s was a turning point. “While many previous studies have reported ongoing ice shelf thinning around Antarctica since the 1990s, we didn’t previously know that a lot of it started around then,” Bingham said.
Satellite altimetry data—measurement of the height of land and ice surfaces—was not available prior to the 1990s, so Miles and Bingham instead used optical images to track variations in the bumps on the ice surface. These bumps are surface expressions of pinning points—places where the floating ice shelf is anchored onto a high point of the seafloor. Pinning points are a useful indicator of ice shelf thickness: Bumps that become smaller or even smoothed out entirely over time indicate that an ice shelf had thinned and had possibly become unpinned.
“Bertie’s novel use of Landsat to map the unanchoring of pinning points serves as a proxy for ice shelf thickness change, alongside the more sophisticated altimetry methods the community has generally used,” Bingham said.
Pine Island Glacier: A Case Study
The image pair at the top of this page shows Pine Island Glacier, one of the regions in the Amundsen Sea Embayment where thinning was already underway in the 1970s. Several bumpy areas visible on the ice surface in January 1973 (upper) are mostly smooth in December 2001 (lower). Images were acquired with the MSS (Multispectral Scanner) on Landsat 1 (upper) and the ETM+ (Enhanced Thematic Mapper Plus) on Landsat 7 (lower). Note that the images use a grayscale palette to achieve a closer match between the different sensors.
“These images show the pinning points getting smaller through time as warm ocean currents melt the ice shelves, causing them to thin and subsequently unanchor from the seafloor highs,” Miles said.
Satellite image of Pine Island Glacier’s ice shelf captured on January 20, 2024, by the Operational Land Imager-2 on Landsat 9.
Miles and Bingham’s findings confirmed that Pine Island Glacier was thinning sooner than most Antarctic ice shelves. Out of roughly 600 pinning points that the researchers tracked, only 15 percent shrank in size from 1973 to 1989, including those on Pine Island Glacier. That number grew to 25 percent between 1990 and 2000, and 37 percent between 2000 and 2022.
The image above, acquired with the OLI-2 (Operational Land Imager-2) on Landsat 9, shows Pine Island Glacier’s ice shelf in January 2024. By then, the smooth, thinning shelf had lost additional ice along its front and northern margin, and fractured ice was visible along the southern edge.
With Pine Island Glacier at or near the point of being completely unanchored, its ability to buttress ice has already been minimized. The “greater concern,” Miles and Bingham pointed out in their paper, might be the other major ice shelves that are still heavily anchored but showing signs of quickly losing their pinning points.
Reference: “Progressive unanchoring of Antarctic ice shelves since 1973” by Bertie W. J. Miles, and Robert G. Bingham, 21 February 2024, Nature.
DOI: 10.1038/s41586-024-07049-0
NASA Earth Observatory images by Wanmei Liang, using Landsat data from the U.S. Geological Survey and pinning point data from Miles, B.W.J., and Bingham, R.G.
Denial of responsibility! Techno Blender is an automatic aggregator of the all world’s media. In each content, the hyperlink to the primary source is specified. All trademarks belong to their rightful owners, all materials to their authors. If you are the owner of the content and do not want us to publish your materials, please contact us by email – [email protected]. The content will be deleted within 24 hours.