
25 Numpy Treasures Buried in the Docs Waiting to Be Found | by Bex T. | Aug, 2022
Get rich in NumPy
Every data scientist admires someone. For some, it might be people who create killer data visualizations; for others, it is simply anyone who answers their StackOverflow questions. For me, it was people who used NumPy like a ninja.
I don’t know. I have always thought that the ability to use a long forsaken function buried deep inside the documentation on rare edge cases spoke a lot about a programmer’s skill. Reinventing the wheel for a particular task is challenging, but that’s not always what you want.
This month, it was time to turn the tables around and become a NumPy ninja myself. Along the way, I said, “why don’t I make others too?”. So, here I am with a list of the coolest and yet rare NumPy functions that, when used, will surely surprise anyone reading your code.
I bet you have used standard NumPy functions like ones_like or zeros_like. Well, full_like is exactly like those two, except you can create a matrix with the same shape as another one, filled with some custom value.
💻Demo
Here, we are creating a matrix of pis, with the shape of array.
📚 Documentation: link
I am sure you use linspace regularly. It can create a custom number of linearly spaced data points within an interval. Its cousin logspace takes this a bit further. It can generate a custom number of points evenly spaced on a logarithmic scale. You can choose any number as a base, as long as it is non-zero:
💻Demo
📚 Documentation: link
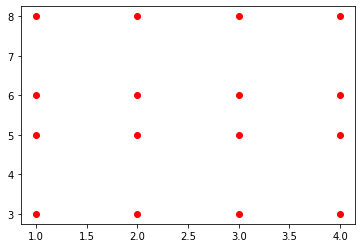
This is one of those functions you see only on documentations. I thought it wasn’t intended for public use for a while because I had such a hard time understanding it. Well, as always, StackOverflow is to the rescue. According to this thread, you can create every possible coordinate pair from a given X and Y arrays using meshgrid. Here is a simple one:
There will be 16 unique coordinate pairs, one for each index-to-index element pair in the resulting arrays.
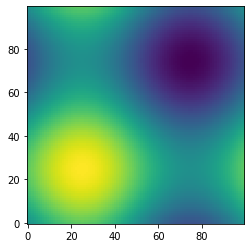
Of course, meshgrid is usually used for more complex tasks that would take forever if done with loops. Plotting a contour graph of the 3D sine function is an example:
💻Demo
📚 Documentation: link
Similar to ones_like or zeros_like, these two functions return zeros above or below a certain diagonal of a matrix. For example, we can use the triu function to create a boolean mask with True values above the main diagonal and use this mask when plotting a correlation heatmap.
💻Demo
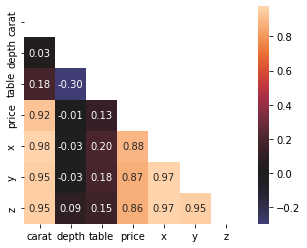
As you can see, a mask created with triu can be used on a correlation matrix to drop the unnecessary upper triangle and the diagonal. This leaves a much more compact and readable heatmap devoid of clutter.
📚 Documentation: link — np.triu
NumPy is all about high-dimensional matrices and ndarrays. Sometimes, you just want to take those arrays and crush them into 1D. This is where you would use ravel or flatten:
💻Demo
Do they look the same? Not exactly. flatten always returns a 1D copy while ravel tries to produce a 1D view of the original array. So, be careful because modifying the returned array from ravel might change the original array. For more info about their differences, check out this StackOverflow thread.
📚 Documentation: link
On Kaggle, these two functions are used regularly. Often, people have multiple predictions for the test set from different models, and they want to ensemble these predictions in some way. To make them easy to work with, they must be combined into a single matrix.
💻Demo
Remember to reshape each array before stacking them with these, as they require 2D arrays by default. That’s why we used the reshape function. Here, reshape(-1, 1) represents converting the array to a single column with as many rows as possible.
Similarly, reshape(1, -1) converts the array to a single row vector with as many columns as possible.
📚 Documentation: link
If you are lazy like me and don’t want to call reshape on all your arrays, there is a much more elegant solution. np.r_ and np.c_ operators (not functions!) allow stacking arrays as rows and columns, respectively.
Below, we are simulating a prediction array with 100 probabilities. To stack them on top of each other, we call np.r_ with the brackets notation (like pandas.DataFrame.loc).
💻Demo
Similarly, np.c_ stacks the arrays next to each other, creating a matrix. However, their functionality isn’t limited to simple horizontal and vertical stacks. They are much more powerful than that. For additional information, I suggest you read the docs.
📚 Documentation: link — np.r_
📚 Documentation: link — np.c_
NumPy is so vast and deep. You probably won’t have the time and patience to learn every function and class of its API. What if you face an unknown function? Well, don’t you go running to the documentation because you have a much better alternative.
The info function can print the docstring of any name in the NumPy API. Here is info used on info:
💻Demo
📚 Documentation: link
As the name suggests, this function returns all the indices of an array where some condition is True:
💻Demo
It is particularly useful when searching for non-zero elements in sparse arrays or even can be used on Pandas DataFrames for a much faster index retrieval based on a condition.
📚 Documentation: link
These two functions will be handy during data cleaning when used with assert statements.
np.all only returns True if all elements inside an array match a specific condition:
💻Demo
Since we created two arrays filled with random numbers, there is no chance every element is equal. There is, however, a much better chance of at least two of them being equal to each other if the numbers are integers:
So, any returns True if at least one element of an array satisfies a particular condition.
📚 Documentation: link — np.all
📚 Documentation: link — np.any
If you ever want to check if two arrays with equal lengths are duplicates of each other, a simple == operator won’t cut it. Sometimes, you might want to compare arrays of floats, but their long decimal places make it hard. In that case, you can use allclose which returns True if all elements of an array are close to each other, given some tolerance.
💻Demo
Note that the function returns True only if the differences are smaller (<) than rtol, not <=!
📚 Documentation: link
While np.sort returns a sorted copy of an array, that’s not always what you want. Sometimes, you need the indices that would sort an array to use the same indices multiple times over for different purposes. That’s where argsort comes in handy:
💻Demo
It is from a family of functions that start with arg, which always return an index or indices from the result of some function. For example, argmax finds the maximum value in an array and returns its index.
📚 Documentation: link
These two boolean functions check if an element in an array is negative infinity or positive infinity. Unfortunately, computers or NumPy doesn’t understand the concept of infinity (well, who does?). They can only represent infinity as some extremely large or small number they can fit into a single bit (I hope I said it correctly).
That’s why when you print the type of np.inf, it returns float:
This means infinity values can easily sneak into an array and break operations that you would use on floats. You need a special function to find these sneaky little …:
💻Demo
📚 Documentation: link
If you want to perform a traditional linear regression, you don’t necessarily need Sklearn. NumPy has got you covered:
💻Demo
polyfit can take two vectors, apply linear regression on them and return a slope and an intercept. You just have to specify the degree with deg, because this function can be used to approximate the roots of any degree polynomial.
Double-checking with Sklearn reveals that the slope and intercept found with polyfit are the same as Sklearn’s LinearRegression model:
📚 Documentation: link
NumPy’s random module has a wide selection of pseudo-random number generators. Along with my favorites such as sample and choice, there are functions to simulate pseudo-perfect probability distributions.
For example, binomial, gamma, normal and tweedie functions draw a custom number of data points from their respective distributions.
You may find them quite helpful when you have to approximate the distributions of the features in your data. For example, below, we check whether diamond prices follow a normal distribution.
💻Demo
This can be done by plotting a KDE of diamond prices on top of a perfect normal distribution to make the differences visible.
📚 Documentation: link
rint is a nifty little function if you ever want to round each element of an array to the nearest integer. You can start using it when you want to convert class probabilities to class labels in binary classification. You don’t have to call the predict method of your model, wasting your time:
💻Demo
📚 Documentation: link
Did you know that arithmetic operations on pure NumPy arrays fail if at least a single element is NaN?
💻Demo
To go around this without modifying the original array, you can use a family of nan functions:
Above is an example of the arithmetic mean function that ignores missing values. Many others work in the same manner:
But you might as well forget about these if you only work with Pandas DataFrames or Series because they ignore NaNs by default.
>>> pd.Series(a).mean()22.0
📚 Documentation: link — np.nanmean
clip is useful when you want to impose a strict limit on the values of your array. Below, we are clipping any values that are outside the hard limits of 10 and 70:
💻Demo
📚 Documentation: link
It is common to work with sparse arrays. Often, they are the result of one-hot encoding a categorical feature with high cardinality or just many binary columns.
You can check the number of non-zero elements in any array with count_nonzero:
💻Demo
Among 100k random integers, ~1000 of them are zeros.
📚 Documentation: link
The final function in our list is array_split. I think you can probably guess what it does from the name – it can be used to chunk ndarrays or DataFrames into N buckets. Besides, it doesn’t raise an error when you want to split the array into non-equal sized chunks like vsplit:
💻Demo
📚 Documentation: link
OK, I lied in the intro a bit. I don’t really admire people who use NumPy well. Actually, I admire anyone who uses some library or tool better than me. So, each of the articles I write is just me trying to push myself and see how it feels to use the things that more experienced folks so elaborately utilize.
Before you leave — my readers are loving these. Why don’t you check them out?
Get rich in NumPy

Every data scientist admires someone. For some, it might be people who create killer data visualizations; for others, it is simply anyone who answers their StackOverflow questions. For me, it was people who used NumPy like a ninja.
I don’t know. I have always thought that the ability to use a long forsaken function buried deep inside the documentation on rare edge cases spoke a lot about a programmer’s skill. Reinventing the wheel for a particular task is challenging, but that’s not always what you want.
This month, it was time to turn the tables around and become a NumPy ninja myself. Along the way, I said, “why don’t I make others too?”. So, here I am with a list of the coolest and yet rare NumPy functions that, when used, will surely surprise anyone reading your code.
I bet you have used standard NumPy functions like ones_like or zeros_like. Well, full_like is exactly like those two, except you can create a matrix with the same shape as another one, filled with some custom value.
💻Demo
Here, we are creating a matrix of pis, with the shape of array.
📚 Documentation: link
I am sure you use linspace regularly. It can create a custom number of linearly spaced data points within an interval. Its cousin logspace takes this a bit further. It can generate a custom number of points evenly spaced on a logarithmic scale. You can choose any number as a base, as long as it is non-zero:
💻Demo
📚 Documentation: link
This is one of those functions you see only on documentations. I thought it wasn’t intended for public use for a while because I had such a hard time understanding it. Well, as always, StackOverflow is to the rescue. According to this thread, you can create every possible coordinate pair from a given X and Y arrays using meshgrid. Here is a simple one:
There will be 16 unique coordinate pairs, one for each index-to-index element pair in the resulting arrays.
Of course, meshgrid is usually used for more complex tasks that would take forever if done with loops. Plotting a contour graph of the 3D sine function is an example:
💻Demo
📚 Documentation: link
Similar to ones_like or zeros_like, these two functions return zeros above or below a certain diagonal of a matrix. For example, we can use the triu function to create a boolean mask with True values above the main diagonal and use this mask when plotting a correlation heatmap.
💻Demo
As you can see, a mask created with triu can be used on a correlation matrix to drop the unnecessary upper triangle and the diagonal. This leaves a much more compact and readable heatmap devoid of clutter.
📚 Documentation: link — np.triu
NumPy is all about high-dimensional matrices and ndarrays. Sometimes, you just want to take those arrays and crush them into 1D. This is where you would use ravel or flatten:
💻Demo
Do they look the same? Not exactly. flatten always returns a 1D copy while ravel tries to produce a 1D view of the original array. So, be careful because modifying the returned array from ravel might change the original array. For more info about their differences, check out this StackOverflow thread.
📚 Documentation: link
On Kaggle, these two functions are used regularly. Often, people have multiple predictions for the test set from different models, and they want to ensemble these predictions in some way. To make them easy to work with, they must be combined into a single matrix.
💻Demo
Remember to reshape each array before stacking them with these, as they require 2D arrays by default. That’s why we used the reshape function. Here, reshape(-1, 1) represents converting the array to a single column with as many rows as possible.
Similarly, reshape(1, -1) converts the array to a single row vector with as many columns as possible.
📚 Documentation: link
If you are lazy like me and don’t want to call reshape on all your arrays, there is a much more elegant solution. np.r_ and np.c_ operators (not functions!) allow stacking arrays as rows and columns, respectively.
Below, we are simulating a prediction array with 100 probabilities. To stack them on top of each other, we call np.r_ with the brackets notation (like pandas.DataFrame.loc).
💻Demo
Similarly, np.c_ stacks the arrays next to each other, creating a matrix. However, their functionality isn’t limited to simple horizontal and vertical stacks. They are much more powerful than that. For additional information, I suggest you read the docs.
📚 Documentation: link — np.r_
📚 Documentation: link — np.c_
NumPy is so vast and deep. You probably won’t have the time and patience to learn every function and class of its API. What if you face an unknown function? Well, don’t you go running to the documentation because you have a much better alternative.
The info function can print the docstring of any name in the NumPy API. Here is info used on info:
💻Demo
📚 Documentation: link
As the name suggests, this function returns all the indices of an array where some condition is True:
💻Demo
It is particularly useful when searching for non-zero elements in sparse arrays or even can be used on Pandas DataFrames for a much faster index retrieval based on a condition.
📚 Documentation: link
These two functions will be handy during data cleaning when used with assert statements.
np.all only returns True if all elements inside an array match a specific condition:
💻Demo
Since we created two arrays filled with random numbers, there is no chance every element is equal. There is, however, a much better chance of at least two of them being equal to each other if the numbers are integers:
So, any returns True if at least one element of an array satisfies a particular condition.
📚 Documentation: link — np.all
📚 Documentation: link — np.any
If you ever want to check if two arrays with equal lengths are duplicates of each other, a simple == operator won’t cut it. Sometimes, you might want to compare arrays of floats, but their long decimal places make it hard. In that case, you can use allclose which returns True if all elements of an array are close to each other, given some tolerance.
💻Demo
Note that the function returns True only if the differences are smaller (<) than rtol, not <=!
📚 Documentation: link
While np.sort returns a sorted copy of an array, that’s not always what you want. Sometimes, you need the indices that would sort an array to use the same indices multiple times over for different purposes. That’s where argsort comes in handy:
💻Demo
It is from a family of functions that start with arg, which always return an index or indices from the result of some function. For example, argmax finds the maximum value in an array and returns its index.
📚 Documentation: link
These two boolean functions check if an element in an array is negative infinity or positive infinity. Unfortunately, computers or NumPy doesn’t understand the concept of infinity (well, who does?). They can only represent infinity as some extremely large or small number they can fit into a single bit (I hope I said it correctly).
That’s why when you print the type of np.inf, it returns float:
This means infinity values can easily sneak into an array and break operations that you would use on floats. You need a special function to find these sneaky little …:
💻Demo
📚 Documentation: link
If you want to perform a traditional linear regression, you don’t necessarily need Sklearn. NumPy has got you covered:
💻Demo
polyfit can take two vectors, apply linear regression on them and return a slope and an intercept. You just have to specify the degree with deg, because this function can be used to approximate the roots of any degree polynomial.
Double-checking with Sklearn reveals that the slope and intercept found with polyfit are the same as Sklearn’s LinearRegression model:
📚 Documentation: link
NumPy’s random module has a wide selection of pseudo-random number generators. Along with my favorites such as sample and choice, there are functions to simulate pseudo-perfect probability distributions.
For example, binomial, gamma, normal and tweedie functions draw a custom number of data points from their respective distributions.
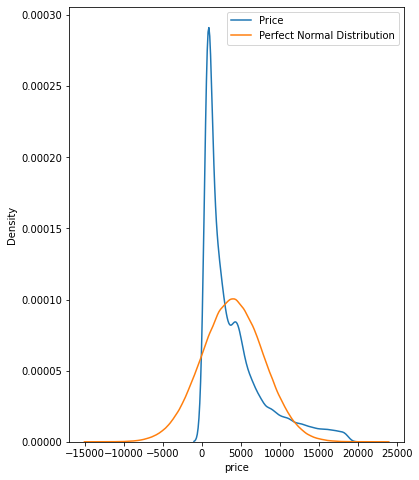
You may find them quite helpful when you have to approximate the distributions of the features in your data. For example, below, we check whether diamond prices follow a normal distribution.
💻Demo
This can be done by plotting a KDE of diamond prices on top of a perfect normal distribution to make the differences visible.
📚 Documentation: link
rint is a nifty little function if you ever want to round each element of an array to the nearest integer. You can start using it when you want to convert class probabilities to class labels in binary classification. You don’t have to call the predict method of your model, wasting your time:
💻Demo
📚 Documentation: link
Did you know that arithmetic operations on pure NumPy arrays fail if at least a single element is NaN?
💻Demo
To go around this without modifying the original array, you can use a family of nan functions:
Above is an example of the arithmetic mean function that ignores missing values. Many others work in the same manner:
But you might as well forget about these if you only work with Pandas DataFrames or Series because they ignore NaNs by default.
>>> pd.Series(a).mean()22.0
📚 Documentation: link — np.nanmean
clip is useful when you want to impose a strict limit on the values of your array. Below, we are clipping any values that are outside the hard limits of 10 and 70:
💻Demo
📚 Documentation: link
It is common to work with sparse arrays. Often, they are the result of one-hot encoding a categorical feature with high cardinality or just many binary columns.
You can check the number of non-zero elements in any array with count_nonzero:
💻Demo
Among 100k random integers, ~1000 of them are zeros.
📚 Documentation: link
The final function in our list is array_split. I think you can probably guess what it does from the name – it can be used to chunk ndarrays or DataFrames into N buckets. Besides, it doesn’t raise an error when you want to split the array into non-equal sized chunks like vsplit:
💻Demo
📚 Documentation: link
OK, I lied in the intro a bit. I don’t really admire people who use NumPy well. Actually, I admire anyone who uses some library or tool better than me. So, each of the articles I write is just me trying to push myself and see how it feels to use the things that more experienced folks so elaborately utilize.
Before you leave — my readers are loving these. Why don’t you check them out?
Denial of responsibility! Techno Blender is an automatic aggregator of the all world’s media. In each content, the hyperlink to the primary source is specified. All trademarks belong to their rightful owners, all materials to their authors. If you are the owner of the content and do not want us to publish your materials, please contact us by email – [email protected]. The content will be deleted within 24 hours.