
5 Ideas to Create New Features from Polygons | by Leonie Monigatti | Jul, 2022
How to Get the Area and Other Features From a WKT String with Shapely
Polygon data can be useful in various applications of data science. For example, in the 2022 Women in Data Science Datathon Phase II challenge one of the datasets contained polygon data of buildings’ floor plans to determine their energy usage.
These polygons can be represented in well-known text (WKT) format. The WKT format is a markup language to represent geometric 2D and 3D objects, such as points, lines, polygons, and so on. In the WKT format, a polygon is represented by the coordinates of each point of the polygon. Here are a couple of examples of a polygon description in WKT format:
"POLYGON ((10 10, 90 10, 90 90, 10 90, 10 10))""POLYGON ((10 10, 90 10, 90 90, 10 90, 10 10), (20 20, 50 20, 50 50, 20 50, 20 20))"
While you could parse the polygon coordinates from the WKT string and write the functions to calculate features like the polygon’s area or perimeter yourself, the Shapely package [1] does all of this for you out of the box. You can simply load a polygon’s WKT string into a Shapely polygon as follows:
import shapely.wkt
from shapely.geometry import Polygonwkt_string = "POLYGON ((10 10, 20 10, 20 80, 90 80, 90 90, 10 90, 10 10))"
polygon = shapely.wkt.loads(wkt_string)
In this article, we will first look at how to visualize a polygon with the Shapely package or the Matplotlib library. Then we will go over five feature engineering ideas from polygons in WKT format.
If you want to play around with the techniques describes in this article, you can download or fork this article’s code from my related Kaggle Notebook.
The first thing you might want to do with the polygon is to visualize it to get a better intuition about it. You can either plot the polygon directly via the Shapely package or you can plot the polygon via its coordinates using the Matplotlib library.
Visualization via Shapely Package
To visualize the mere shape of the polygon, you can display the Shapely polygon after loading it.
wkt_string = "POLYGON ((10 10, 20 10, 20 80, 90 80, 90 90, 10 90, 10 10))"
polygon = shapely.wkt.loads(wkt_string)
polygon

wkt_string = "POLYGON ((10 10, 90 10, 90 90, 10 90, 10 10), (20 20, 50 20, 50 50, 20 50, 20 20))"
polygon = shapely.wkt.loads(wkt_string)
polygon

While this is a quick option, its disadvantage is that you don’t get an intuition about the coordinates.
Visualization via Matplotlib Library
To visualize the polygon by its coordinates, you can use the Matplotlib library in addition to the Shapely package.
import matplotlib.pyplot as plt
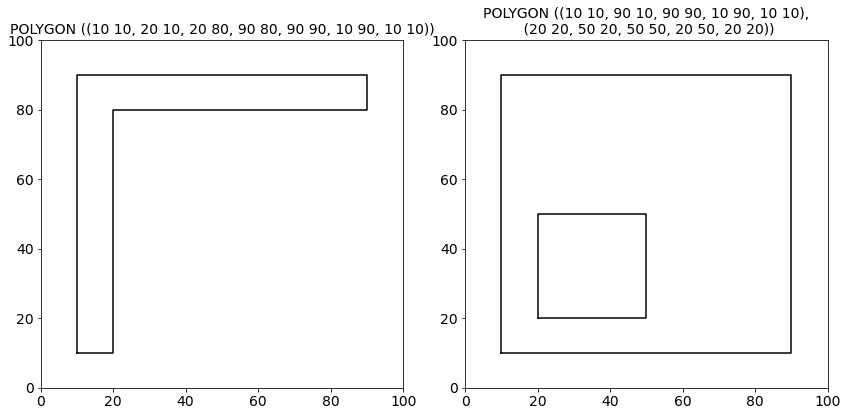
From the Shapely polygon, you can retrieve the polygon’s x and y coordinates from the xy attribute of the exterior (polygon.exterior.xy) and interiors (polygon.interiors[i].xy). The ‘exterior’ is the outer shape of the polygon. Additionally a polygon can have none, one or more ‘interiors’, which are smaller polygons within the exterior. You can plot the exterior and interiors of the polygon from their xy attributes as follows:
def plot_polygon(wkt_string, ax=None):
polygon = shapely.wkt.loads(wkt_string)# Retrieve and plot x and y coordinates of exterior
x, y = polygon.exterior.xy
ax.plot(x, y, color = 'black')
# Retrieve and plot x and y coordinates of interior
for interior in polygon.interiors:
x, y = interior.xy
ax.plot(x, y, color = 'black')
ax.set_title(wkt_string.replace("),", "),\n"), fontsize=14)
ax.set_xlim([0,100])
ax.set_ylim([0,100])
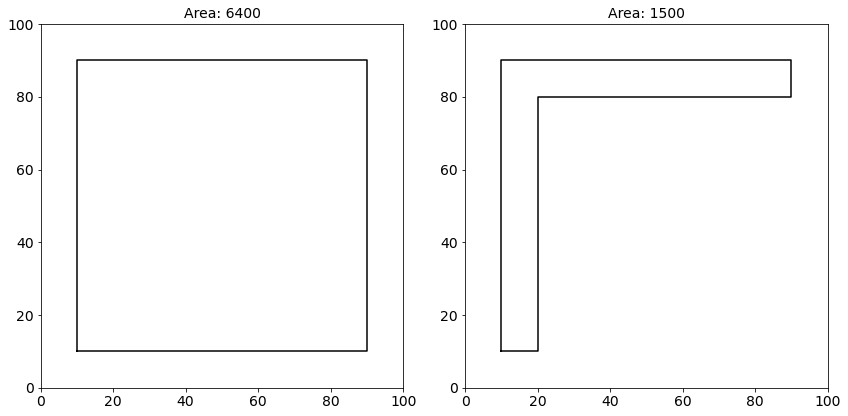
After you have visualized the polygon, you might want to know how to calculate the area of the polygon from its given coordinates. Instead of writing your own function to calculate it, you can simply retrieve the polygon’s area from the Shapely polygon’s attribute area.
Let’s plot a few polygons and verify their areas. Below on the left-hand side, you can see a quadratic polygon with an edge length of 80 units. The Shapely polygon’s area attribute returns a value of 6400, which corresponds to 80 times 80. And is, therefore, correct.
area = polygon.area
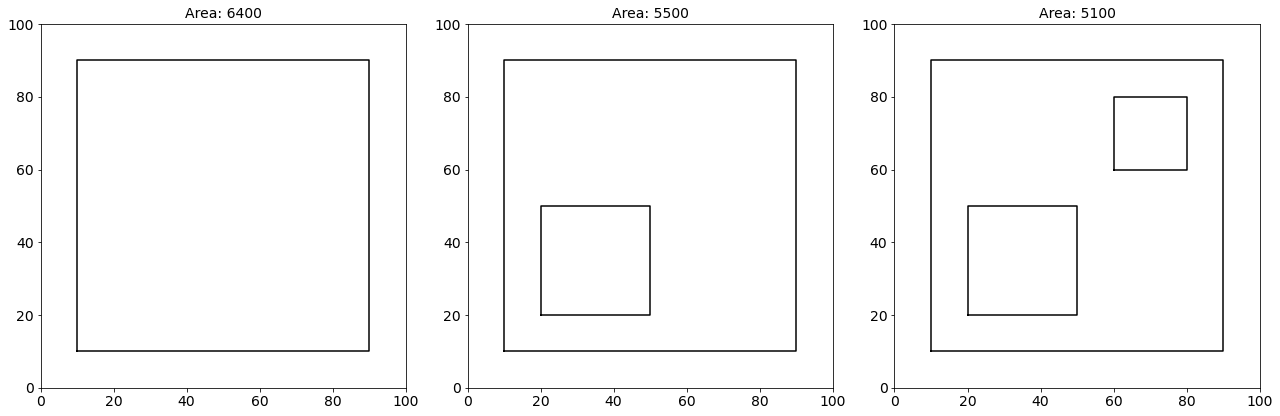
However, not all polygons are closed shapes. Sometimes, polygons can have ‘holes’, which are called interiors in the Shapely package. If we plot and verify their area, we can see that the area of the polygons with interiors is smaller than the same polygon without any interiors because the area of the interior is subtracted from the area of the exterior.
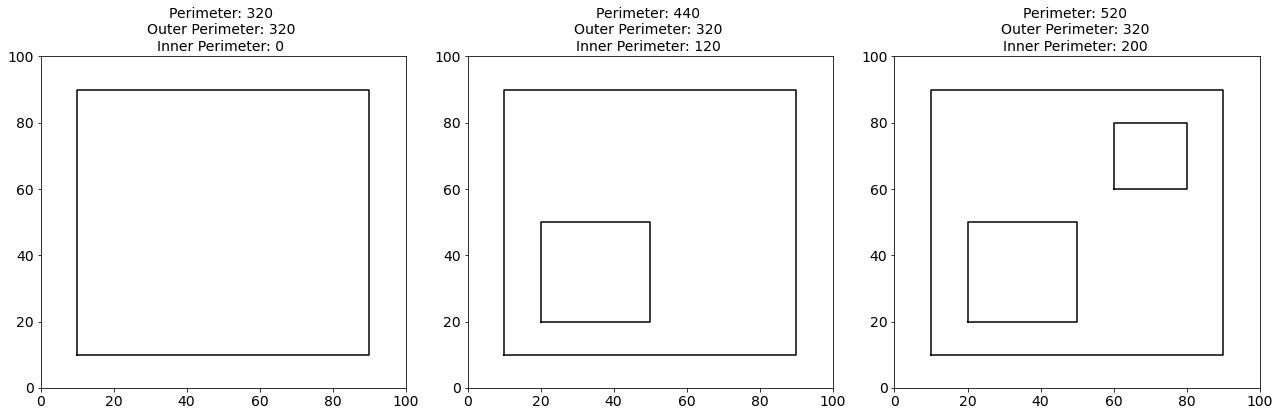
Next, you might want to know how to calculate the perimeter of the polygon from its given coordinates.
Let’s plot a few polygons again and verify their perimeters. Below, you can again see the quadratic polygon from our previous example with an edge length of 80 units. The Shapely polygon’s length attribute returns a value of 320, which corresponds to four times 80. And is, therefore, correct.
Again, some polygons have interiors. If we retrieve the perimeter for a polygon with interiors, the perimeter increases, because the perimeter of the interior is added. You can create new features for the outer and inner perimeters as follows:
perimeter = polygon.length
outer_perimeter = polygon.exterior.length
inner_perimeter = perimeter - outer_perimeter
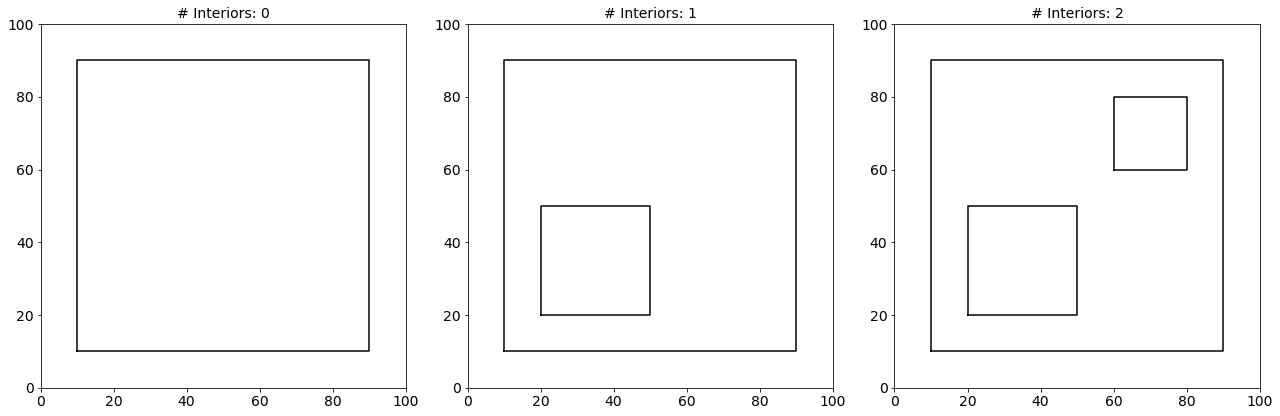
As you have already seen, polygons can have so-called interiors. These are the holes in the exterior polygon. The Shapely package provides an array of the interiors polygon.interiors from which you can get the number of interiors:
num_interiors = len(list(polygon.interiors))
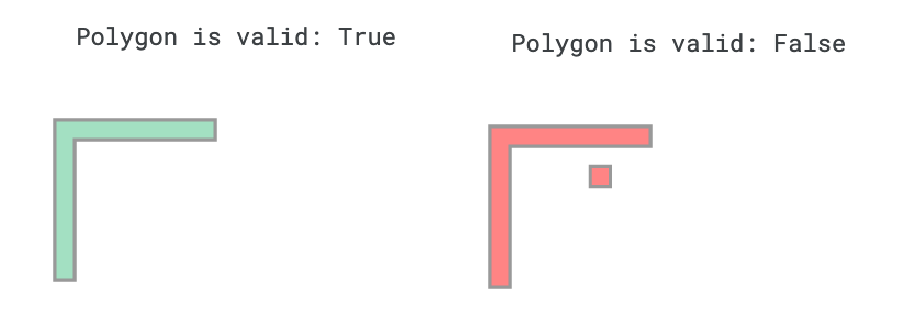
Polygons can be invalid when a polygon’s interior intersects with the exterior or if the interior lies outside of the exterior. When you plot a Shapely polygon, the package indicates whether the polygon is valid or invalid with the polygon’s coloring. A valid polygon is filled with green color, while an invalid polygon is visualized in red. A new feature can be created from the validity of a polygon. For this, you can use the boolean attribute is_valid.
validity = polygon.is_valid
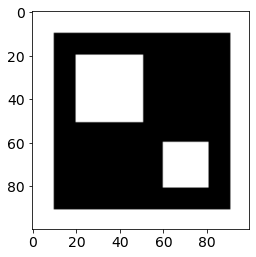
Aside from creating new features from the polygon’s attributes, you could also create a mask from the polygon’s coordinates if you want to apply some computer vision models to it.
The above function returns the polygons mask as a NumPy array.
array([[0, 0, 0, ..., 0, 0, 0],
[0, 0, 0, ..., 0, 0, 0],
[0, 0, 0, ..., 0, 0, 0],
...,
[0, 0, 0, ..., 0, 0, 0],
[0, 0, 0, ..., 0, 0, 0],
[0, 0, 0, ..., 0, 0, 0]], dtype=uint8)
If we plot the the NumPy array, the mask looks as follows:
The WKT format is a simple way to describe a polygon. With the help of the Shapely package, you can convert the WKT string to a Shapely polygon object and take advantage of its attributes. In this article, you have learned how to visualize a polygon with Matplotlib and/or Shapely. Additionally, we have discussed five ideas to create new features from the polygon:
- Area of a polygon
- Perimeter of a polygon
- Number of interiors of a polygon
- Validity of a polygon
- Mask of a polygon
If you want to play around with the techniques described in this article, you can download or fork this article’s code from my related Kaggle Notebook.
[1] S. Gillies, “The Shapely User Manual.” shapely.readthedocs.io. https://shapely.readthedocs.io/en/stable/manual.html (accessed June 20, 2022)
How to Get the Area and Other Features From a WKT String with Shapely

Polygon data can be useful in various applications of data science. For example, in the 2022 Women in Data Science Datathon Phase II challenge one of the datasets contained polygon data of buildings’ floor plans to determine their energy usage.
These polygons can be represented in well-known text (WKT) format. The WKT format is a markup language to represent geometric 2D and 3D objects, such as points, lines, polygons, and so on. In the WKT format, a polygon is represented by the coordinates of each point of the polygon. Here are a couple of examples of a polygon description in WKT format:
"POLYGON ((10 10, 90 10, 90 90, 10 90, 10 10))""POLYGON ((10 10, 90 10, 90 90, 10 90, 10 10), (20 20, 50 20, 50 50, 20 50, 20 20))"
While you could parse the polygon coordinates from the WKT string and write the functions to calculate features like the polygon’s area or perimeter yourself, the Shapely package [1] does all of this for you out of the box. You can simply load a polygon’s WKT string into a Shapely polygon as follows:
import shapely.wkt
from shapely.geometry import Polygonwkt_string = "POLYGON ((10 10, 20 10, 20 80, 90 80, 90 90, 10 90, 10 10))"
polygon = shapely.wkt.loads(wkt_string)
In this article, we will first look at how to visualize a polygon with the Shapely package or the Matplotlib library. Then we will go over five feature engineering ideas from polygons in WKT format.
If you want to play around with the techniques describes in this article, you can download or fork this article’s code from my related Kaggle Notebook.
The first thing you might want to do with the polygon is to visualize it to get a better intuition about it. You can either plot the polygon directly via the Shapely package or you can plot the polygon via its coordinates using the Matplotlib library.
Visualization via Shapely Package
To visualize the mere shape of the polygon, you can display the Shapely polygon after loading it.
wkt_string = "POLYGON ((10 10, 20 10, 20 80, 90 80, 90 90, 10 90, 10 10))"
polygon = shapely.wkt.loads(wkt_string)
polygon
wkt_string = "POLYGON ((10 10, 90 10, 90 90, 10 90, 10 10), (20 20, 50 20, 50 50, 20 50, 20 20))"
polygon = shapely.wkt.loads(wkt_string)
polygon
While this is a quick option, its disadvantage is that you don’t get an intuition about the coordinates.
Visualization via Matplotlib Library
To visualize the polygon by its coordinates, you can use the Matplotlib library in addition to the Shapely package.
import matplotlib.pyplot as plt
From the Shapely polygon, you can retrieve the polygon’s x and y coordinates from the xy attribute of the exterior (polygon.exterior.xy) and interiors (polygon.interiors[i].xy). The ‘exterior’ is the outer shape of the polygon. Additionally a polygon can have none, one or more ‘interiors’, which are smaller polygons within the exterior. You can plot the exterior and interiors of the polygon from their xy attributes as follows:
def plot_polygon(wkt_string, ax=None):
polygon = shapely.wkt.loads(wkt_string)# Retrieve and plot x and y coordinates of exterior
x, y = polygon.exterior.xy
ax.plot(x, y, color = 'black')
# Retrieve and plot x and y coordinates of interior
for interior in polygon.interiors:
x, y = interior.xy
ax.plot(x, y, color = 'black')
ax.set_title(wkt_string.replace("),", "),\n"), fontsize=14)
ax.set_xlim([0,100])
ax.set_ylim([0,100])
After you have visualized the polygon, you might want to know how to calculate the area of the polygon from its given coordinates. Instead of writing your own function to calculate it, you can simply retrieve the polygon’s area from the Shapely polygon’s attribute area.
Let’s plot a few polygons and verify their areas. Below on the left-hand side, you can see a quadratic polygon with an edge length of 80 units. The Shapely polygon’s area attribute returns a value of 6400, which corresponds to 80 times 80. And is, therefore, correct.
area = polygon.area
However, not all polygons are closed shapes. Sometimes, polygons can have ‘holes’, which are called interiors in the Shapely package. If we plot and verify their area, we can see that the area of the polygons with interiors is smaller than the same polygon without any interiors because the area of the interior is subtracted from the area of the exterior.
Next, you might want to know how to calculate the perimeter of the polygon from its given coordinates.
Let’s plot a few polygons again and verify their perimeters. Below, you can again see the quadratic polygon from our previous example with an edge length of 80 units. The Shapely polygon’s length attribute returns a value of 320, which corresponds to four times 80. And is, therefore, correct.
Again, some polygons have interiors. If we retrieve the perimeter for a polygon with interiors, the perimeter increases, because the perimeter of the interior is added. You can create new features for the outer and inner perimeters as follows:
perimeter = polygon.length
outer_perimeter = polygon.exterior.length
inner_perimeter = perimeter - outer_perimeter
As you have already seen, polygons can have so-called interiors. These are the holes in the exterior polygon. The Shapely package provides an array of the interiors polygon.interiors from which you can get the number of interiors:
num_interiors = len(list(polygon.interiors))
Polygons can be invalid when a polygon’s interior intersects with the exterior or if the interior lies outside of the exterior. When you plot a Shapely polygon, the package indicates whether the polygon is valid or invalid with the polygon’s coloring. A valid polygon is filled with green color, while an invalid polygon is visualized in red. A new feature can be created from the validity of a polygon. For this, you can use the boolean attribute is_valid.
validity = polygon.is_valid
Aside from creating new features from the polygon’s attributes, you could also create a mask from the polygon’s coordinates if you want to apply some computer vision models to it.
The above function returns the polygons mask as a NumPy array.
array([[0, 0, 0, ..., 0, 0, 0],
[0, 0, 0, ..., 0, 0, 0],
[0, 0, 0, ..., 0, 0, 0],
...,
[0, 0, 0, ..., 0, 0, 0],
[0, 0, 0, ..., 0, 0, 0],
[0, 0, 0, ..., 0, 0, 0]], dtype=uint8)
If we plot the the NumPy array, the mask looks as follows:
The WKT format is a simple way to describe a polygon. With the help of the Shapely package, you can convert the WKT string to a Shapely polygon object and take advantage of its attributes. In this article, you have learned how to visualize a polygon with Matplotlib and/or Shapely. Additionally, we have discussed five ideas to create new features from the polygon:
- Area of a polygon
- Perimeter of a polygon
- Number of interiors of a polygon
- Validity of a polygon
- Mask of a polygon
If you want to play around with the techniques described in this article, you can download or fork this article’s code from my related Kaggle Notebook.
[1] S. Gillies, “The Shapely User Manual.” shapely.readthedocs.io. https://shapely.readthedocs.io/en/stable/manual.html (accessed June 20, 2022)
Denial of responsibility! Techno Blender is an automatic aggregator of the all world’s media. In each content, the hyperlink to the primary source is specified. All trademarks belong to their rightful owners, all materials to their authors. If you are the owner of the content and do not want us to publish your materials, please contact us by email – [email protected]. The content will be deleted within 24 hours.