
AI in Logistics: Optimizing Container Fill Rate with Computer Vision
Leveraging AI for smarter logistics and data-driven perspective on container utilization, maximizing efficiency and ROI
One of the most glaring inefficiencies in logistics is the problem of empty space. Shipping containers, the lifeblood of global trade, often sail partially filled, wasting precious space and resources. This inefficiency translates to an increase in operating costs and damage to the sustainability of business and the environment.
Higher transportation costs
Carriers base their charges on the container size, not the amount of cargo it holds. This means that even a partially filled container costs the same as a fully packed one. To put it in perspective, A.P. Moller — Maersk, as reported by Statista (2018–2023), saw a significant increase in freight rates during the Covid-19 pandemic. So, shipping partially filled containers essentially boils down to paying for empty space instead of valuable cargo, impacting your return on investment.
Increased carbon footprint across the supply chain
Splitting the same load which could be fit into a single container means double the transportation means.
Increased cargo goods damage
With more space, cargo isn’t as tightly packed. This allows boxes, pallets, and goods to move around more freely during transit, particularly due to vibrations and sudden stops.
To help identify this at its root before the container is sealed and shipped, a container fill rate analyzer that uses computer vision and artificial intelligence (AI) to understand the fill rate of each layer of pallet loaded into the container was developed. The fill rate of a shipping container is the percentage of available space occupied by cargo.
Using computer vision with the help of AI, the manual task of judging the fill rate of each image by a person could be eliminated and focus could be put into solving the actual issue.
Container Fill Rate AI Github code
Portal
Approach
There are many approaches to this challenge. One could use a Single Shot Detector (SSD) or You Only Look Once (YOLO) model to detect pallets, and then calculate the fill rate from there. Arcgic explains how SSD works in detail on its documentation page here.
However, the idea was to test out the Meta Segment Anything Model (SAM) for this specific use case. In the Meta AI blog here, Meta shared a demo playground and a general overview of what SAM is capable of. This method is of course not domain-specific compared to training a model for this specific task, but generalized models has come a long way and it is worth testing the feasibility of such a task.
SAM is very versatile and comes with 2 detection methods, one being the automatic mask generation where it will segment everything on an image, and the other being prompt-based, where a coordinate on the image guides the segmentation. Meta shared a very detailed post on how SAM was built here.
SAM Automatic Mask Generation
# Initialize Segement Anything and pass in the image for auto mask generation
mask_generator = SamAutomaticMaskGenerator(sam)
masks = mask_generator.generate(input_layer_img)
This method works great and it is easy to set up with just 2 lines of Python code, and everything will be segmented in the image without any instructions.
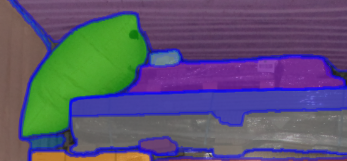
However, the challenge comes when deciding if the odd size of pallets or foreign objects is part of the layer. In the above image, the airbag, some filling wrappers and cardboard are segmented, looking like a pallet.
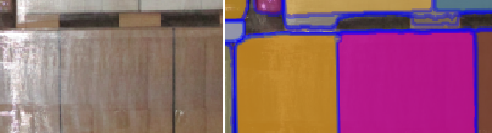
Occasionally, due to straps or loose wrappers, that gets segmented separately as well as shown above.
Prompt-based segmentation
Prompt-based segmentation requires hints to guide SAM in knowing where and how the focus area should be. Testing against the Automatic Mask Generation method, the prompt-based segmentation method is more viable for this project.
Below is the pseudocode and code snippet of the program execution flow.
# Read the input image
input_layer_img: np.ndarray = cv2.imread(img_fp)

# Downscale image for performance
input_layer_img = downscale(input_layer_img)

# First, find all the labels in the image
# The label position can help prompt SAM to generate segments better
label_points: list] = pallet_label_detector(input_layer_img)

# Send the labels position to SAM and get a segment mask
segmented_mask: np.ndarray = prompt_segment(label_points, input_layer_img)

# Draw on the original image with values from the mask
segment_color = np.random.random(3) * 100

segmented_img = input_layer_img.copy()
segmented_img[segmented_mask] = segment_color
mask = cv2.inRange(segmented_img, segment_color - 10, segment_color + 10)

# Based on the segmented image, find the fill rate
fill_rate: float = fill_rate_calculation(label_points, mask, segmented_img)
In this case, the coordinates of each label on the pallet can be passed into SAM to segment. Label extraction can be accomplished using computer vision techniques, such as defining the region of interest, color filtering, and contour. This process is business domain-specific, but generally, most labels are close to white.
The more accurate way to detect labels is by scanning the Serial Shipping Container Code (SSCC) barcode, however, the image quality is insufficient to detect barcodes.
lower_val = np.array([150, 150, 150], dtype=np.uint8)
upper_val = np.array([255, 255, 255], dtype=np.uint8)

# preparing the mask to overlay
mask = cv2.inRange(layer_img, lower_val, upper_val)

# find contours
contours = cv2.findContours(thresh, cv2.RETR_EXTERNAL, cv2.CHAIN_APPROX_SIMPLE)[0]

new_mask = np.ones(img.shape[:2], dtype="uint8") * 255
prompt_points = []

for c in contours:
    x, y, w, h = cv2.boundingRect(c)

    # only select points in our region of interest
    if is_outside_roi(layer_img, x, y):
        continue

    if w * h < 1000:
        continue

    cv2.rectangle(new_mask, (x, y), (x + w, y + h), (0, 0, 255), -1)

    # We calculate the center of the label to be passed for prompting
    prompt_points.append([int(x + (w / 2)), int(y + (h / 2))])

res_final = cv2.bitwise_and(layer_img, layer_img, mask=cv2.bitwise_not(new_mask))
cv2.imshow("Labels only", res_final)
A color filter between 150 to 255 is applied to the input image as shown in the Python code above, and the masks are extracted from the input image.
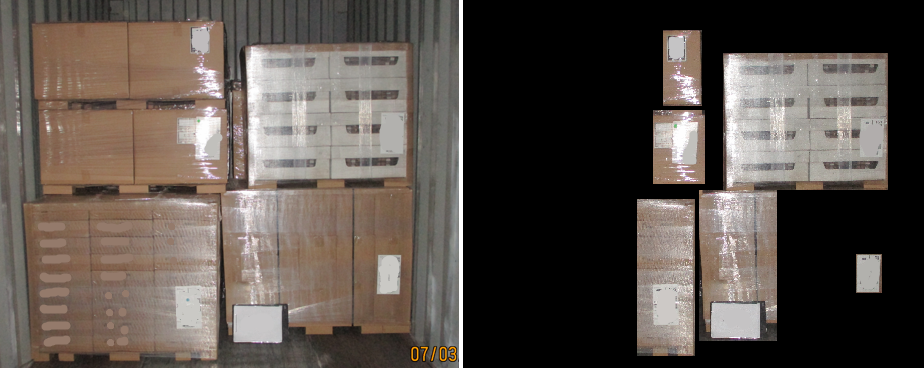
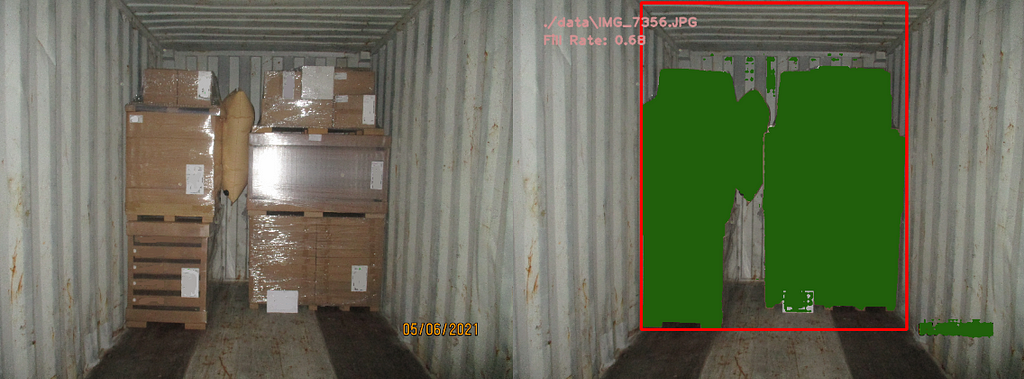
Prompting the labels position will SAM produce a more domain-focused result. Despite the labels extracted are not exact in size, an estimation is sufficient in allowing the prompt to segment the necessary.
# prompt_points contains the coordinates of the labels
# [ [x, y], [x, y]...]
input_point_nd = np.array(prompt_points, dtype=np.int32)

# As all the prompt points are labels, we are giving them a category of 1
input_label = np.ones(len(prompt_points), dtype=np.int32)

predictor.set_image(segment_img)
masks, scores, _ = predictor.predict(
    point_coords=input_point_nd,
    point_labels=input_label,
    multimask_output=False,
)
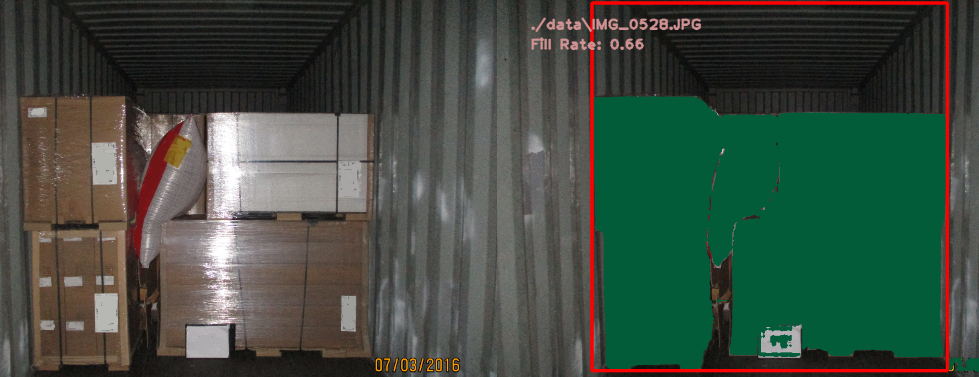
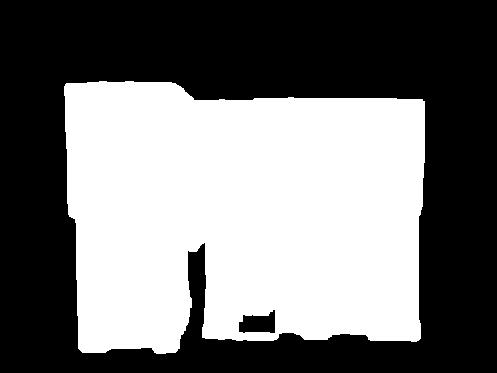
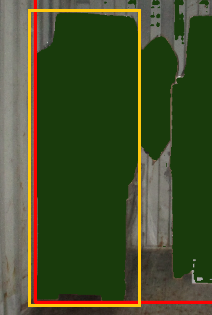
The segmented output is shown in the image above. A simple method was used to calculate the boundaries of the container, illustrated by the red box. The image is later than converted into black and white for the fill rate calculation.
# Sum of white pixels
total_white = np.sum(fill_rate_used[tallest:ch, cx: cw] == 255)

# Sum of black pixels
total_black = np.sum(fill_rate_used[tallest:ch, cx: cw] == 0)

# Percentage of white
fill_rate = round(total_white / (total_white + total_black), 2)
The estimated fill rate would be the occupied colored space compared to the unoccupied space, which is black pixels in the container boundary. Few morphological operations can be applied such as dilation to fill up the gaps between boxes.
Results
With the current test cases in hand based on a personal environment, the results are close to reality. This significantly reduces the manual workload of analyzing each container fill rate, and a more consistent judgment of fill rate percentage is in place. Odd-shaped pallets are taken into account as the label will be detected, and unwanted segmentations are reduced due to the prompting of labels coordinate.
With this result for every layer loaded in a container, companies are now able to analyze the cause of partial loads and decide if there is a gap in the operational or planning process. Operationally, the decision to seal a container before shipping could also use the fill rate indicator as a factor.
By tracking results over time, a visible trend could be built to visualize if there are any improvements in the loading process.
Limitations
Pallets Layer
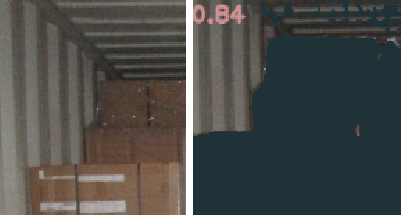
One of the limitations would be the pallets behind are occasionally segmented with the pallets in front if the colors match too closely. This causes a false calculation of the fill rate as the compartment is considered empty in reality. To overcome such limitations, using prompt-based segmentation may not be ideal, but a combination of automatic mask generation and label detection.
Foreign Object
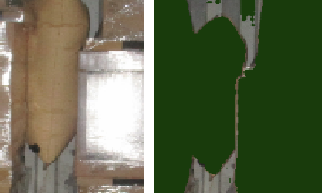
Another challenge comes with the segmentation of the airbags. In some cases, the airbags camouflaged with the pallets, causing the segmentation to be grouped.
One option to overcome such limitation is to draw a box wherever possible, removing odd-shaped segmentations. However, this again brings another challenge for odd-shaped pallets, think of a pallet of non-foldable chairs.
Closing
With the use of computer vision, teams and co-workers in a company can make data-driven decisions without the hassle of manually analyzing individual images.
There are many ways this project can be extended. Some of them includes:
- Loading trucks and even small vans (Last mile delivery)
- Real-time estimation/End of shipment loading analyzing from video
- Translating fill rate into monetary value and potential cubic meter (m3) lost
- Calculating the probability of cargo goods damage based on the fill rate threshold
The biggest contributor to securing a good output is to have a consistent and standardized input image or stream. This will greatly improve the container height estimation and pallet placement detection. The optimal way would be to detect the SSCC barcodes and use the barcode position to prompt the segmentation, however, that would come at the cost of more expensive cameras.
Everyone is free to adapt the project code from container-fill-rate-ai Github, with respect to Meta SAM Apache License. This project is not perfect, and there is always many room for enhancement.
Extending this project for your own business/use case may require understanding the code and tweaking the parameters in the Python file. More importantly, domain knowledge of the business process is essential before jumping into the code. This would help you understand how you can adapt the code to the business.
To understand more about this project, feel free to reach out to:
Website: https://jonathanlawhh.com/
Email: [email protected]
AI in Logistics: Optimizing Container Fill Rate with Computer Vision was originally published in Towards Data Science on Medium, where people are continuing the conversation by highlighting and responding to this story.
Leveraging AI for smarter logistics and data-driven perspective on container utilization, maximizing efficiency and ROI
One of the most glaring inefficiencies in logistics is the problem of empty space. Shipping containers, the lifeblood of global trade, often sail partially filled, wasting precious space and resources. This inefficiency translates to an increase in operating costs and damage to the sustainability of business and the environment.
Higher transportation costs
Carriers base their charges on the container size, not the amount of cargo it holds. This means that even a partially filled container costs the same as a fully packed one. To put it in perspective, A.P. Moller — Maersk, as reported by Statista (2018–2023), saw a significant increase in freight rates during the Covid-19 pandemic. So, shipping partially filled containers essentially boils down to paying for empty space instead of valuable cargo, impacting your return on investment.
Increased carbon footprint across the supply chain
Splitting the same load which could be fit into a single container means double the transportation means.
Increased cargo goods damage
With more space, cargo isn’t as tightly packed. This allows boxes, pallets, and goods to move around more freely during transit, particularly due to vibrations and sudden stops.
To help identify this at its root before the container is sealed and shipped, a container fill rate analyzer that uses computer vision and artificial intelligence (AI) to understand the fill rate of each layer of pallet loaded into the container was developed. The fill rate of a shipping container is the percentage of available space occupied by cargo.
Using computer vision with the help of AI, the manual task of judging the fill rate of each image by a person could be eliminated and focus could be put into solving the actual issue.
Container Fill Rate AI Github code
Portal
Approach
There are many approaches to this challenge. One could use a Single Shot Detector (SSD) or You Only Look Once (YOLO) model to detect pallets, and then calculate the fill rate from there. Arcgic explains how SSD works in detail on its documentation page here.
However, the idea was to test out the Meta Segment Anything Model (SAM) for this specific use case. In the Meta AI blog here, Meta shared a demo playground and a general overview of what SAM is capable of. This method is of course not domain-specific compared to training a model for this specific task, but generalized models has come a long way and it is worth testing the feasibility of such a task.
SAM is very versatile and comes with 2 detection methods, one being the automatic mask generation where it will segment everything on an image, and the other being prompt-based, where a coordinate on the image guides the segmentation. Meta shared a very detailed post on how SAM was built here.
SAM Automatic Mask Generation
# Initialize Segement Anything and pass in the image for auto mask generation
mask_generator = SamAutomaticMaskGenerator(sam)
masks = mask_generator.generate(input_layer_img)
This method works great and it is easy to set up with just 2 lines of Python code, and everything will be segmented in the image without any instructions.
However, the challenge comes when deciding if the odd size of pallets or foreign objects is part of the layer. In the above image, the airbag, some filling wrappers and cardboard are segmented, looking like a pallet.
Occasionally, due to straps or loose wrappers, that gets segmented separately as well as shown above.
Prompt-based segmentation
Prompt-based segmentation requires hints to guide SAM in knowing where and how the focus area should be. Testing against the Automatic Mask Generation method, the prompt-based segmentation method is more viable for this project.
Below is the pseudocode and code snippet of the program execution flow.
# Read the input image
input_layer_img: np.ndarray = cv2.imread(img_fp)

# Downscale image for performance
input_layer_img = downscale(input_layer_img)

# First, find all the labels in the image
# The label position can help prompt SAM to generate segments better
label_points: list] = pallet_label_detector(input_layer_img)

# Send the labels position to SAM and get a segment mask
segmented_mask: np.ndarray = prompt_segment(label_points, input_layer_img)

# Draw on the original image with values from the mask
segment_color = np.random.random(3) * 100

segmented_img = input_layer_img.copy()
segmented_img[segmented_mask] = segment_color
mask = cv2.inRange(segmented_img, segment_color - 10, segment_color + 10)

# Based on the segmented image, find the fill rate
fill_rate: float = fill_rate_calculation(label_points, mask, segmented_img)
In this case, the coordinates of each label on the pallet can be passed into SAM to segment. Label extraction can be accomplished using computer vision techniques, such as defining the region of interest, color filtering, and contour. This process is business domain-specific, but generally, most labels are close to white.
The more accurate way to detect labels is by scanning the Serial Shipping Container Code (SSCC) barcode, however, the image quality is insufficient to detect barcodes.
lower_val = np.array([150, 150, 150], dtype=np.uint8)
upper_val = np.array([255, 255, 255], dtype=np.uint8)

# preparing the mask to overlay
mask = cv2.inRange(layer_img, lower_val, upper_val)

# find contours
contours = cv2.findContours(thresh, cv2.RETR_EXTERNAL, cv2.CHAIN_APPROX_SIMPLE)[0]

new_mask = np.ones(img.shape[:2], dtype="uint8") * 255
prompt_points = []

for c in contours:
    x, y, w, h = cv2.boundingRect(c)

    # only select points in our region of interest
    if is_outside_roi(layer_img, x, y):
        continue

    if w * h < 1000:
        continue

    cv2.rectangle(new_mask, (x, y), (x + w, y + h), (0, 0, 255), -1)

    # We calculate the center of the label to be passed for prompting
    prompt_points.append([int(x + (w / 2)), int(y + (h / 2))])

res_final = cv2.bitwise_and(layer_img, layer_img, mask=cv2.bitwise_not(new_mask))
cv2.imshow("Labels only", res_final)
A color filter between 150 to 255 is applied to the input image as shown in the Python code above, and the masks are extracted from the input image.
Prompting the labels position will SAM produce a more domain-focused result. Despite the labels extracted are not exact in size, an estimation is sufficient in allowing the prompt to segment the necessary.
# prompt_points contains the coordinates of the labels
# [ [x, y], [x, y]...]
input_point_nd = np.array(prompt_points, dtype=np.int32)

# As all the prompt points are labels, we are giving them a category of 1
input_label = np.ones(len(prompt_points), dtype=np.int32)

predictor.set_image(segment_img)
masks, scores, _ = predictor.predict(
    point_coords=input_point_nd,
    point_labels=input_label,
    multimask_output=False,
)
The segmented output is shown in the image above. A simple method was used to calculate the boundaries of the container, illustrated by the red box. The image is later than converted into black and white for the fill rate calculation.
# Sum of white pixels
total_white = np.sum(fill_rate_used[tallest:ch, cx: cw] == 255)

# Sum of black pixels
total_black = np.sum(fill_rate_used[tallest:ch, cx: cw] == 0)

# Percentage of white
fill_rate = round(total_white / (total_white + total_black), 2)
The estimated fill rate would be the occupied colored space compared to the unoccupied space, which is black pixels in the container boundary. Few morphological operations can be applied such as dilation to fill up the gaps between boxes.
Results
With the current test cases in hand based on a personal environment, the results are close to reality. This significantly reduces the manual workload of analyzing each container fill rate, and a more consistent judgment of fill rate percentage is in place. Odd-shaped pallets are taken into account as the label will be detected, and unwanted segmentations are reduced due to the prompting of labels coordinate.
With this result for every layer loaded in a container, companies are now able to analyze the cause of partial loads and decide if there is a gap in the operational or planning process. Operationally, the decision to seal a container before shipping could also use the fill rate indicator as a factor.
By tracking results over time, a visible trend could be built to visualize if there are any improvements in the loading process.
Limitations
Pallets Layer
One of the limitations would be the pallets behind are occasionally segmented with the pallets in front if the colors match too closely. This causes a false calculation of the fill rate as the compartment is considered empty in reality. To overcome such limitations, using prompt-based segmentation may not be ideal, but a combination of automatic mask generation and label detection.
Foreign Object
Another challenge comes with the segmentation of the airbags. In some cases, the airbags camouflaged with the pallets, causing the segmentation to be grouped.
One option to overcome such limitation is to draw a box wherever possible, removing odd-shaped segmentations. However, this again brings another challenge for odd-shaped pallets, think of a pallet of non-foldable chairs.
Closing
With the use of computer vision, teams and co-workers in a company can make data-driven decisions without the hassle of manually analyzing individual images.
There are many ways this project can be extended. Some of them includes:
- Loading trucks and even small vans (Last mile delivery)
- Real-time estimation/End of shipment loading analyzing from video
- Translating fill rate into monetary value and potential cubic meter (m3) lost
- Calculating the probability of cargo goods damage based on the fill rate threshold
The biggest contributor to securing a good output is to have a consistent and standardized input image or stream. This will greatly improve the container height estimation and pallet placement detection. The optimal way would be to detect the SSCC barcodes and use the barcode position to prompt the segmentation, however, that would come at the cost of more expensive cameras.
Everyone is free to adapt the project code from container-fill-rate-ai Github, with respect to Meta SAM Apache License. This project is not perfect, and there is always many room for enhancement.
Extending this project for your own business/use case may require understanding the code and tweaking the parameters in the Python file. More importantly, domain knowledge of the business process is essential before jumping into the code. This would help you understand how you can adapt the code to the business.
To understand more about this project, feel free to reach out to:
Website: https://jonathanlawhh.com/
Email: [email protected]
AI in Logistics: Optimizing Container Fill Rate with Computer Vision was originally published in Towards Data Science on Medium, where people are continuing the conversation by highlighting and responding to this story.
Denial of responsibility! Techno Blender is an automatic aggregator of the all world’s media. In each content, the hyperlink to the primary source is specified. All trademarks belong to their rightful owners, all materials to their authors. If you are the owner of the content and do not want us to publish your materials, please contact us by email – [email protected]. The content will be deleted within 24 hours.