An Illustrated Explanation of Hypothesis Tests | by Gustavo Santos | Jun, 2022
Learn once and for all what is a Hypothesis Test. Code in Python.
Disclaimer: Hey, just to make things clear, this is not a sponsored post. I really liked the book.
Hypothesis Test
I recently read this nice book The Cartoon Introduction to Statistics. It brings a fun and smooth introduction to basic Statistics concepts, all presented like a comic book.
One of the points that called my attention, and it is what I bring to light today, is how the author Grady Klein explains the Hypothesis Test concept. In his words…
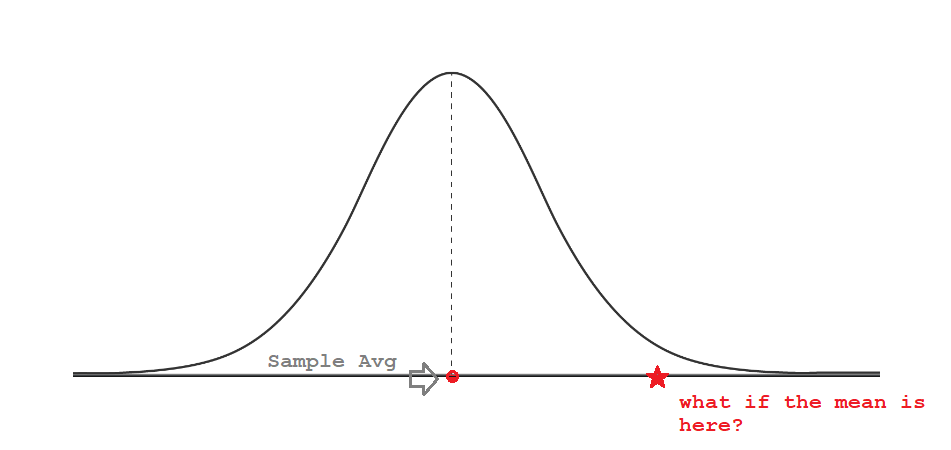
Hypothesis Test is a fancy name for guessing the Population average and comparing that guess to the average in the sample we already have.

Now let’s say we collected another sample and we don’t know if that sample is coming from our distribution. What can we do? We test the hypothesis that they are both from the same distribution (population) by calculating the probability value (a.k.a. p-value) that a sample with mean on the “star” point comes from the same population as the sample with the mean on the “circle” point.
In our test, everyone is innocent until otherwise proven. Meaning, the test will assume that sample 1 and sample 2 are from the same population and will call that assumption the Null Hypothesis (Ho). But if we are wrong, they are not from the same population, that assumption is named Alternative Hypothesis (Ha).
Let’s determine a threshold for the test. 5% is the rule of thumb in this case. If the probability (p-value) that both samples are from the same population is less than 5%, then well, we might be wrong, so we have strong evidence to reject Ho. But if our p-value is higher than 5%, our chances tell that we don’t have enough evidence to reject Ho, so we keep that assumption that the samples are from the same population. Maybe it was just an odd sample with a weird mean value.
# Imports
import pandas as pd
import numpy as np
import seaborn as sns
import matplotlib.pyplot as plt
from scipy.stats import f_oneway
from statsmodels.stats.weightstats import ztest# Create df
df = pd.DataFrame({'id': np.arange(1,51),'val': np.random.randn(50)})# Mean
df.val.mean()
[OUT] -0.054089553629615886#----# Create df2
df2 = pd.DataFrame({'id': np.arange(1,51),
'val': np.random.randint(40,50, size=50)/10})# Mean 2
df2.val.mean()
[OUT] 4.513333333333334# Test
"Can a distribution with mean sample 2 come from the same population as sample 1?
Ho : p-value >= 0.05 == Yes, same population
Ha : p-value < 0.05 == No, different population"
sample1 = df.val
mean_sample2 = df2.val.mean()# Z-test
stat, p = ztest(sample1, value=mean_sample2)
print(f'Test statistics: {stat}')
print(f'p-Value: {p}')[OUT]
Test statistics: -26.21106515561983 p-Value: 1.9876587424280803e-151
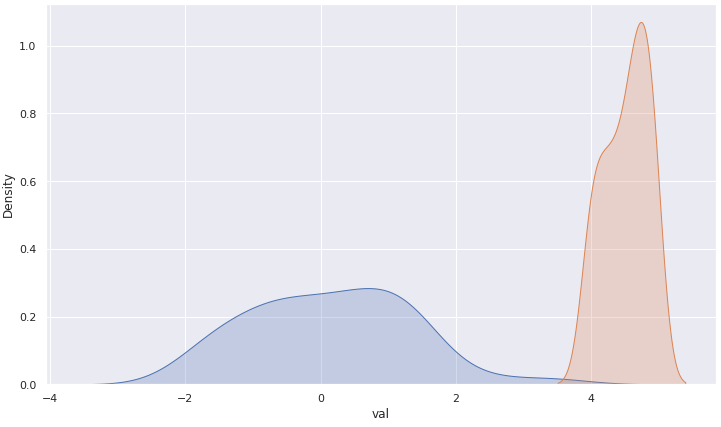
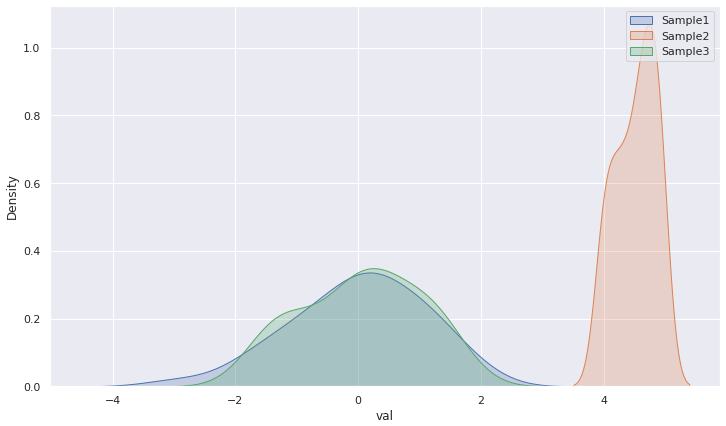
As we can see, the null hypothesis (Ho) is rejected, thus we have strong evidence to conclude that both samples come from different populations.
In practice, this means that, if we consider that the true population mean is -0.054 — the same from sample 1 — then it would be very very very unlikely to find a sample with mean value of 4.51. It has almost zero chance to be found, actually.

From the Same Population
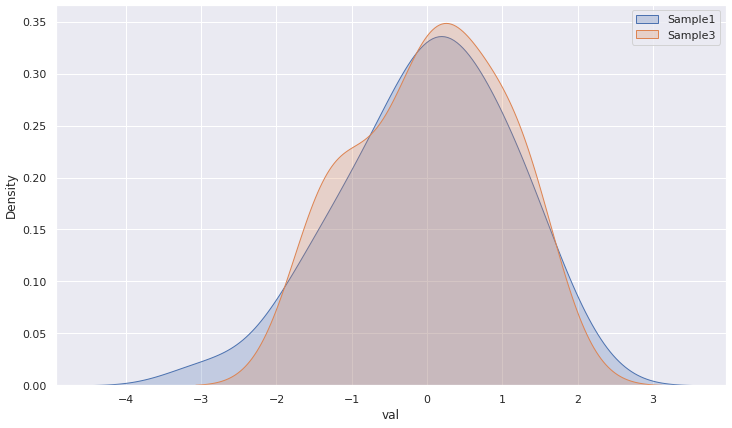
Let’s try another test. Now I will actually extract a sample 3 out of sample 1 and test to see if the probability of them being from the same population is true or not.
# Create df3
df3 = pd.DataFrame({'id': np.arange(1,31),'val': np.random.choice(df['val'].values, size=30)})# Mean 3
df3.val.mean()
[OUT] 0.04843756603887838
Cool, the mean is much closer to the sample 1 mean (-0.054). It’s a good sign.
sample1 = df.val
mean_sample3 = df3.val.mean()stat, p = ztest(sample1, value=mean_sample3)
print(f'Test statistics: {stat}')
print(f'p-Value: {p}')[OUT]
Test statistics: -0.3488669147011808 p-Value: 0.727189224747824
Wow! 72% of probability that these two random normal samples come from the same population. That makes sense. 3 was extracted from 1!
# Plot
sns.kdeplot(data=df, x='val', fill=True)
sns.kdeplot(data=df3, x='val', fill=True)
plt.legend(['Sample1', 'Sample3']);

Before You Go
I wanted to create this quick post to show you what’s behind an Hypothesis test. What is that we are actually testing. That was the goal here, so you could build your intuition around this important statistical concept.
- We have a sample with mean -0.05
- We have a sample 2 with mean on 4.51
- Hypothesis Test: Is it possible that both samples came from the same population, considering that the true population mean is -0.05 or very close to it?
- We begin assuming that yes, they are from the same population. We then calculate the p-value, or probability value.
- If it is less than 5% of chance, we reject it in favor of Ha, saying that the statistical evidence show that those two samples are from different distributions. If it is more than 5%, then we don’t have statistical evidence to say that they are not from the same population, thus we assume they are.
GitHub code: https://tinyurl.com/3csp5ejm
If you liked this content, follow my blog for more.
Learn once and for all what is a Hypothesis Test. Code in Python.

Disclaimer: Hey, just to make things clear, this is not a sponsored post. I really liked the book.
Hypothesis Test
I recently read this nice book The Cartoon Introduction to Statistics. It brings a fun and smooth introduction to basic Statistics concepts, all presented like a comic book.
One of the points that called my attention, and it is what I bring to light today, is how the author Grady Klein explains the Hypothesis Test concept. In his words…
Hypothesis Test is a fancy name for guessing the Population average and comparing that guess to the average in the sample we already have.

Now let’s say we collected another sample and we don’t know if that sample is coming from our distribution. What can we do? We test the hypothesis that they are both from the same distribution (population) by calculating the probability value (a.k.a. p-value) that a sample with mean on the “star” point comes from the same population as the sample with the mean on the “circle” point.
In our test, everyone is innocent until otherwise proven. Meaning, the test will assume that sample 1 and sample 2 are from the same population and will call that assumption the Null Hypothesis (Ho). But if we are wrong, they are not from the same population, that assumption is named Alternative Hypothesis (Ha).
Let’s determine a threshold for the test. 5% is the rule of thumb in this case. If the probability (p-value) that both samples are from the same population is less than 5%, then well, we might be wrong, so we have strong evidence to reject Ho. But if our p-value is higher than 5%, our chances tell that we don’t have enough evidence to reject Ho, so we keep that assumption that the samples are from the same population. Maybe it was just an odd sample with a weird mean value.
# Imports
import pandas as pd
import numpy as np
import seaborn as sns
import matplotlib.pyplot as plt
from scipy.stats import f_oneway
from statsmodels.stats.weightstats import ztest# Create df
df = pd.DataFrame({'id': np.arange(1,51),'val': np.random.randn(50)})# Mean
df.val.mean()
[OUT] -0.054089553629615886#----# Create df2
df2 = pd.DataFrame({'id': np.arange(1,51),
'val': np.random.randint(40,50, size=50)/10})# Mean 2
df2.val.mean()
[OUT] 4.513333333333334# Test
"Can a distribution with mean sample 2 come from the same population as sample 1?
Ho : p-value >= 0.05 == Yes, same population
Ha : p-value < 0.05 == No, different population"
sample1 = df.val
mean_sample2 = df2.val.mean()# Z-test
stat, p = ztest(sample1, value=mean_sample2)
print(f'Test statistics: {stat}')
print(f'p-Value: {p}')[OUT]
Test statistics: -26.21106515561983 p-Value: 1.9876587424280803e-151
As we can see, the null hypothesis (Ho) is rejected, thus we have strong evidence to conclude that both samples come from different populations.
In practice, this means that, if we consider that the true population mean is -0.054 — the same from sample 1 — then it would be very very very unlikely to find a sample with mean value of 4.51. It has almost zero chance to be found, actually.

From the Same Population
Let’s try another test. Now I will actually extract a sample 3 out of sample 1 and test to see if the probability of them being from the same population is true or not.
# Create df3
df3 = pd.DataFrame({'id': np.arange(1,31),'val': np.random.choice(df['val'].values, size=30)})# Mean 3
df3.val.mean()
[OUT] 0.04843756603887838
Cool, the mean is much closer to the sample 1 mean (-0.054). It’s a good sign.
sample1 = df.val
mean_sample3 = df3.val.mean()stat, p = ztest(sample1, value=mean_sample3)
print(f'Test statistics: {stat}')
print(f'p-Value: {p}')[OUT]
Test statistics: -0.3488669147011808 p-Value: 0.727189224747824
Wow! 72% of probability that these two random normal samples come from the same population. That makes sense. 3 was extracted from 1!
# Plot
sns.kdeplot(data=df, x='val', fill=True)
sns.kdeplot(data=df3, x='val', fill=True)
plt.legend(['Sample1', 'Sample3']);

Before You Go
I wanted to create this quick post to show you what’s behind an Hypothesis test. What is that we are actually testing. That was the goal here, so you could build your intuition around this important statistical concept.
- We have a sample with mean -0.05
- We have a sample 2 with mean on 4.51
- Hypothesis Test: Is it possible that both samples came from the same population, considering that the true population mean is -0.05 or very close to it?
- We begin assuming that yes, they are from the same population. We then calculate the p-value, or probability value.
- If it is less than 5% of chance, we reject it in favor of Ha, saying that the statistical evidence show that those two samples are from different distributions. If it is more than 5%, then we don’t have statistical evidence to say that they are not from the same population, thus we assume they are.
GitHub code: https://tinyurl.com/3csp5ejm
If you liked this content, follow my blog for more.
