
Anomaly Detection in Multivariate Time Series with Network Graphs | by Marco Cerliani | Aug, 2022
Beyond PCA: A Graph-based Approach to Detect Anomalous Patterns
When working on an anomaly detection task, we are used to discovering and pointing out situations where the data register unseen dynamics. The ability to study the past and extrapolate a “normal” behavior is crucial for the success of most anomaly detection applications. In this situation, an adequate learning strategy must take into consideration the temporal dependency. What in the past may be considered “anomalous”, now may be marked as “normal” since the underlying data dynamics are prone to change.
A good multivariate anomaly detection system should study the historical relationship between data and alert possible future divergencies. Given these premises, the PCA (Principal Component Analysis) algorithm reveals to be a very good candidate for the task. Together with the old but gold PCA, we can leverage the connected nature of the signals at our disposal to develop a network structure and detect anomalies with a graph-based approach.
In this post, we carry out a multivariate anomaly detection task adopting an unsupervised approach based on network clustering. We build a network graph from a bunch of time series looking at their correlation. Then we apply, on top of the correlation matrix, the DBSCAN algorithm to identify potential anomalous patterns.
We imagine working in a multivariate system. All the series show a positive correlation degree between each other while maintaining stationery for the whole period of reference.
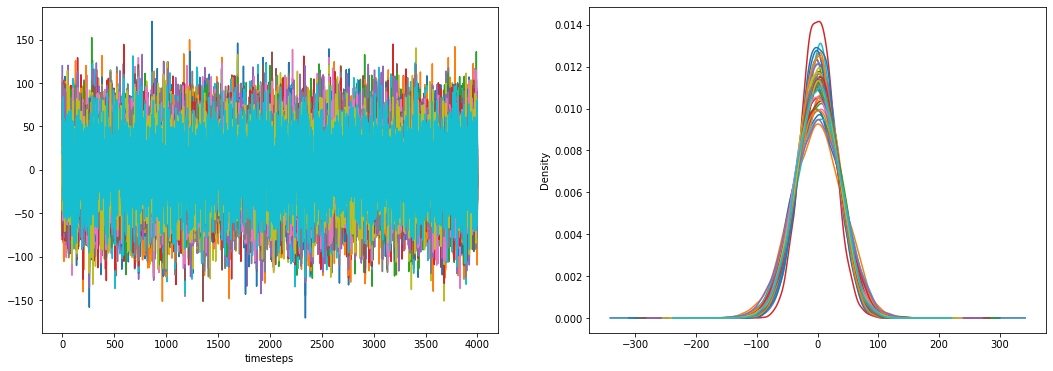
We are not looking for pointwise univariate anomalies. We are searching for multivariate anomalies which happen when the underlying series relationships change over time or assume unexpected behaviors.
We manually insert in our data an anomalous period. We change a sequential bunch of observations, in a predefined feature, with some gaussian noise. We do this “swapping” operation taking care to maintain the same mean and standard deviation of the original data. In this way, the anomalous period is not visible simply by looking at the feature distributions. In other words, we alter the correlation present in the data, in a given time range, by inserting some gaussian noise that is not related to anything in the entire system.
Our scope is to develop an anomaly detection solution that can correctly point out the changes in feature relationships. Let’s start adopting an approach based on PCA.
PCA fits particularly well in our scenario. This is not surprising since it’s widely adopted in a lot of industrial applications for anomaly detection. Its adaptability and flexibility make it the standard solution when needing to detect anomalies in a multivariate system.
Detecting anomalies with PCA is straightforward. We leverage the compression ability of PCA to reduce the original feature dimensionality of the data. In this way, we preserve only meaningful interactions while reducing the number of features and discharging the noise. The dimensionality reduction operation is fully reversible. We can come back to the original data shape effortlessly using only the learned relationships in the original set of data.
We can calculate the reconstruction error to see and summarize the goodness of the compression operation.

We can see the reconstruction error as an anomaly score. A high magnitude of the reconstruction error means that a change in the data relationships has happened. We can compute it sample-wise to attribute an anomaly score to each sample. We can also compute it for each feature over time and observe which feature is affected by an anomaly behavior. In both cases, we follow a temporal validation strategy to simulate the real data flow in a time-dependent system.
In our simulation study, we see how the reconstruction error increase in correspondence with the artificial anomalous period (both samples and feature-wise).
Detecting anomalies in a multivariate system in the presence of serial correlation is a hot topic. There are a lot of approaches to carry out the problem (for example Anomaly Detection in Multivariate Time Series with VAR). We could also imagine a correlated system like a network. The series make up the nodes and the correlation degrees between them, in a given time frame, establish their linkage.
To develop our graph-based methodology, as a first step, we simply have to divide the data into temporal windows of the same size.

Then we should compute the correlation of the series in each time window. The correlation matrix is used as an approximation of the internal system dynamics and the relationships between series. Other similarity measures can work well like euclidean distance or dynamic time warping.
As a final step, we fit a DBSCAN algorithm on each similarity matrix. In a normal situation, we should expect all the series to belong to the same cluster. In case of anomalies, we expect to have multiple clusters of series.

Correlated series are supposed to move together. If one of them changes its direction, concerning the others, we can mark it as anomalous. To get the best from this methodology, it’s important to work with series that show the same correlation degrees. That it’s not always possible due to the complex nature of some systems. In these cases, a preliminary clustering should be made. A simple hierarchical clustering may be good to group the series according to their nature and enable DBSCAN to achieve the best performances.

In the end, the entire procedure detects the change in the internal system dynamic in correspondence with the anomalous period.

In this post, we introduced an interesting approach for anomaly detection based on graph networks. We implemented it and compared it with a standard methodology based on PCA. Both techniques showed the ability to detect multivariate anomalies in a highly correlated system. At the same time, they appear to be fast and fully interpretable to fit in real-time.
Beyond PCA: A Graph-based Approach to Detect Anomalous Patterns
When working on an anomaly detection task, we are used to discovering and pointing out situations where the data register unseen dynamics. The ability to study the past and extrapolate a “normal” behavior is crucial for the success of most anomaly detection applications. In this situation, an adequate learning strategy must take into consideration the temporal dependency. What in the past may be considered “anomalous”, now may be marked as “normal” since the underlying data dynamics are prone to change.
A good multivariate anomaly detection system should study the historical relationship between data and alert possible future divergencies. Given these premises, the PCA (Principal Component Analysis) algorithm reveals to be a very good candidate for the task. Together with the old but gold PCA, we can leverage the connected nature of the signals at our disposal to develop a network structure and detect anomalies with a graph-based approach.
In this post, we carry out a multivariate anomaly detection task adopting an unsupervised approach based on network clustering. We build a network graph from a bunch of time series looking at their correlation. Then we apply, on top of the correlation matrix, the DBSCAN algorithm to identify potential anomalous patterns.
We imagine working in a multivariate system. All the series show a positive correlation degree between each other while maintaining stationery for the whole period of reference.
We are not looking for pointwise univariate anomalies. We are searching for multivariate anomalies which happen when the underlying series relationships change over time or assume unexpected behaviors.
We manually insert in our data an anomalous period. We change a sequential bunch of observations, in a predefined feature, with some gaussian noise. We do this “swapping” operation taking care to maintain the same mean and standard deviation of the original data. In this way, the anomalous period is not visible simply by looking at the feature distributions. In other words, we alter the correlation present in the data, in a given time range, by inserting some gaussian noise that is not related to anything in the entire system.
Our scope is to develop an anomaly detection solution that can correctly point out the changes in feature relationships. Let’s start adopting an approach based on PCA.
PCA fits particularly well in our scenario. This is not surprising since it’s widely adopted in a lot of industrial applications for anomaly detection. Its adaptability and flexibility make it the standard solution when needing to detect anomalies in a multivariate system.
Detecting anomalies with PCA is straightforward. We leverage the compression ability of PCA to reduce the original feature dimensionality of the data. In this way, we preserve only meaningful interactions while reducing the number of features and discharging the noise. The dimensionality reduction operation is fully reversible. We can come back to the original data shape effortlessly using only the learned relationships in the original set of data.
We can calculate the reconstruction error to see and summarize the goodness of the compression operation.
We can see the reconstruction error as an anomaly score. A high magnitude of the reconstruction error means that a change in the data relationships has happened. We can compute it sample-wise to attribute an anomaly score to each sample. We can also compute it for each feature over time and observe which feature is affected by an anomaly behavior. In both cases, we follow a temporal validation strategy to simulate the real data flow in a time-dependent system.
In our simulation study, we see how the reconstruction error increase in correspondence with the artificial anomalous period (both samples and feature-wise).
Detecting anomalies in a multivariate system in the presence of serial correlation is a hot topic. There are a lot of approaches to carry out the problem (for example Anomaly Detection in Multivariate Time Series with VAR). We could also imagine a correlated system like a network. The series make up the nodes and the correlation degrees between them, in a given time frame, establish their linkage.
To develop our graph-based methodology, as a first step, we simply have to divide the data into temporal windows of the same size.
Then we should compute the correlation of the series in each time window. The correlation matrix is used as an approximation of the internal system dynamics and the relationships between series. Other similarity measures can work well like euclidean distance or dynamic time warping.
As a final step, we fit a DBSCAN algorithm on each similarity matrix. In a normal situation, we should expect all the series to belong to the same cluster. In case of anomalies, we expect to have multiple clusters of series.
Correlated series are supposed to move together. If one of them changes its direction, concerning the others, we can mark it as anomalous. To get the best from this methodology, it’s important to work with series that show the same correlation degrees. That it’s not always possible due to the complex nature of some systems. In these cases, a preliminary clustering should be made. A simple hierarchical clustering may be good to group the series according to their nature and enable DBSCAN to achieve the best performances.
In the end, the entire procedure detects the change in the internal system dynamic in correspondence with the anomalous period.
In this post, we introduced an interesting approach for anomaly detection based on graph networks. We implemented it and compared it with a standard methodology based on PCA. Both techniques showed the ability to detect multivariate anomalies in a highly correlated system. At the same time, they appear to be fast and fully interpretable to fit in real-time.
Denial of responsibility! Techno Blender is an automatic aggregator of the all world’s media. In each content, the hyperlink to the primary source is specified. All trademarks belong to their rightful owners, all materials to their authors. If you are the owner of the content and do not want us to publish your materials, please contact us by email – [email protected]. The content will be deleted within 24 hours.