
Create Many-To-One relationships Between Columns in a Synthetic Table with PySpark UDFs
Leverage some simple equations to generate related columns in test tables.
I’ve recently been playing around with Databricks Labs Data Generator to create completely synthetic datasets from scratch. As part of this, I’ve looked at building sales data around different stores, employees, and customers. As such, I wanted to create relationships between the columns I was artificially populating — such as mapping employees and customers to a certain store.
Through using PySpark UDFs and a bit of logic, we can generate related columns which follow a many-to-one relationship. With a bit of magic, we are even able to extend the logic to give some variance in this mapping — like a customer generally buying from their local store but sometimes from a different store.
Use Databricks Labs Data Generator to generate our basic DataFrame
Note: You can skip this section if not required!
First up, we need to create a DataFrame with our first randomly-generated column. In our case, we’re going to start with the store, as logically we will have “many employees per store” and “many customers repeatedly shopping at a store”.
With a Star Schema Data Model in mind, we’re going to start with our Sales Fact table — a transactional table which will contain key values for the Sale Id, Store Id, Employee Id and Customer Id, the Sale Amount along with some datetime data for the purchase. We can then fill out the specifics about the Store, Employee and Customer in dimension tables further down the line.
We’ll start small — a table with 1000 sales will do. We now need to decide how to split these sales up between stores, employees and customers. Let’s suggest the following:
- # Stores = 20
- # Employees = 100
- # Customers = 700
We can also say that the sales will be recorded over the course of last month:
- First Sale Date = 2023–11–01
- Last Sale Date = 2023–11–30
The Sale Id needs to be a unique column so we can generate an Id column for this. We now need to distribute the 1000 sales across the 20 stores. For simplicity we will assume this is random.
Using Databricks Lab Generator we can do this with the following code:
https://medium.com/media/1dbbf19e973a3afea5526d7c613ffc8d/hrefhttps://medium.com/media/b66c9f36f7f8e0378e89d2839eab7dfa/hrefhttps://medium.com/media/87284680b5d1453a517dc9ba491d5169/href
Now add some code to record when the sales were made and their amount. To keep things simple, we’ll round the timestamp of the sale to the nearest hour.
https://medium.com/media/7a068c3c2af10db25a149bc117aa9831/href
To calculate the sale amount, we can use the “expr” parameter in our withColumn expression to allow us to generate a random number, with some rules/boundaries.
https://medium.com/media/527be3b6e46203b82d69b71f3e118c05/href
In this case, the expression is quite straight-forward: produce a random number (between 0 and 1), add 0.1 (ensuring sale values are not 0) and multiply by 350.
We’ve got our basic shape for the DataFrame now, so put it all together:
https://medium.com/media/0dcda45fd358954946a751d2277a66d3/href
We can create a quick Data Profile to look at the distribution of values in the columns:
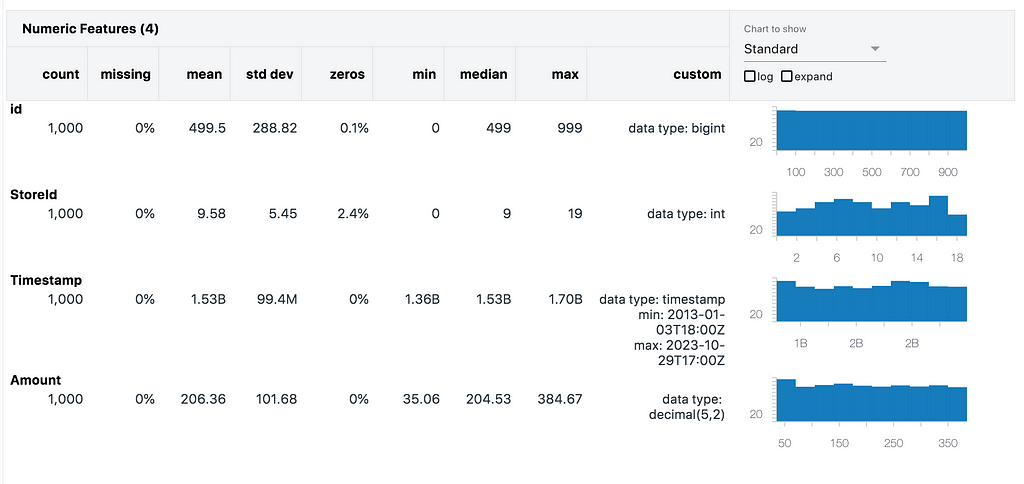
We can see that the StoreId distribution is relatively even across the 20 stores, with no missing values and averages around the centre as we would expect. The same follows for the Timestamps and amount values.
Add a dependent Many-To-One column
Now we can add our Employee Id column to the DataFrame. We’re done with Databricks Lab Data Generator now, so will just use PySpark operations to add columns to the DataFrame.
Stepping back from the code, we want to model this as the following statements:
- There are 20 stores.
- Each store has more than 1 employee.
- Each employee works at a single store only.
First we need to split the employees between the stores. The following python function can be used to do so:
https://medium.com/media/ccc1120174ff30fa5f4b3fbc78243d85/href
Now that we have our distribution of employees for each store, let’s start assigning Ids!
The employeesPerStore list ensures that the employee Ids per store do not overlap. We can use this to randomly assign an employee Id to a sale in the table with the following equation:
https://medium.com/media/de106d99c7675d2dcadbaa794a484ca3/href
This function currently only works for a single value — we need to put this into something that a PySpark DataFrame can work with (functionally, and quickly!)
We can pass PySpark UDFs to the withColumn method, so let’s reformat this logic into a function and set it to a UDF:
https://medium.com/media/5061f4dc681c9a78a07158aa452cd14d/href
Now call this as a new column in the DataFrame:
https://medium.com/media/c0ab8deeb651ff670c54ce53e136881e/href
We can quickly test this looks correct by using the Visualisation tool in Databricks to see the distinct count of Employee Ids per Store Id. This is my preference but you could also use group by logic or other plotting modules, if desired.
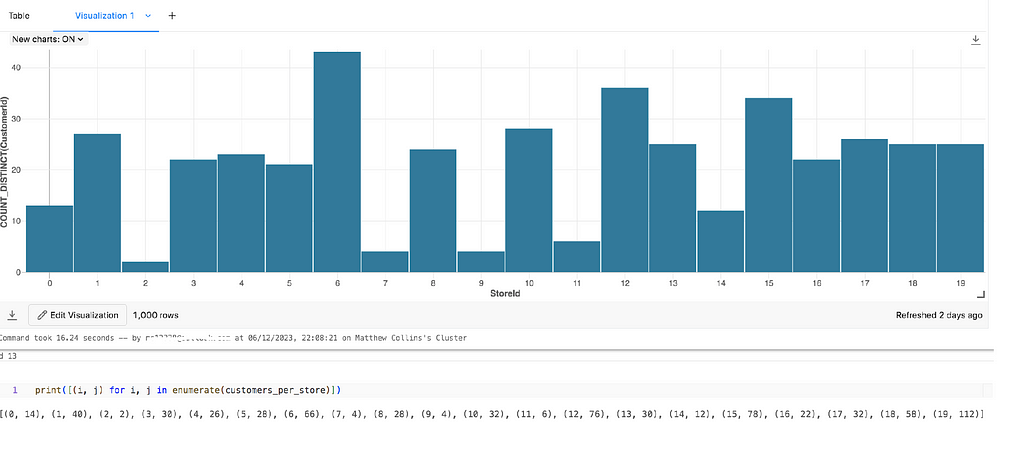
Important Note: This logic allows for employees to be missed from the results. This means that it is possible for an employee to make 0 sales, and thus not be included in the DataFrame. We’ll look at how to ensure all customers have sales recorded against them in the next section.
Add the customers column
The customers column is a bit different… while our use-case suggests it is common for a customer to shop at a single store multiple times, it is entirely possible that they got to a different store one day. How do we model this?
We’ve got the starting points with the work done for our employees column, so can repeat the get_employees function and UDF logic for customers as below:
https://medium.com/media/38ba0fef63c1b950c9dc9ffe815daa94/href
We’ve again potentially missed a few customers off here. Here are a few approaches to rectify this:
- Recalculate in while loop until you converge on a DataFrame which contains all customers (inefficient, costly, could run indefinitely)
- Randomly update customer Ids in while loop until all customers in DataFrame (requires logic to only overwrite same stores, could also run indefinitely)
- Return a list of all customer Ids with more than 1 record in the sales table, and randomly overwrite until all missing Ids are added (also needs logic for overwriting customers in same store, may also require while loop logic)
- Reverse the process and start with employees. This ensures each employee is randomly assigned to rows. We can then use the mapping and apply the store Id.
Hopefully it is clear why the last option is the lowest effort to compute — we have all the code required so just need to reformat things slightly.
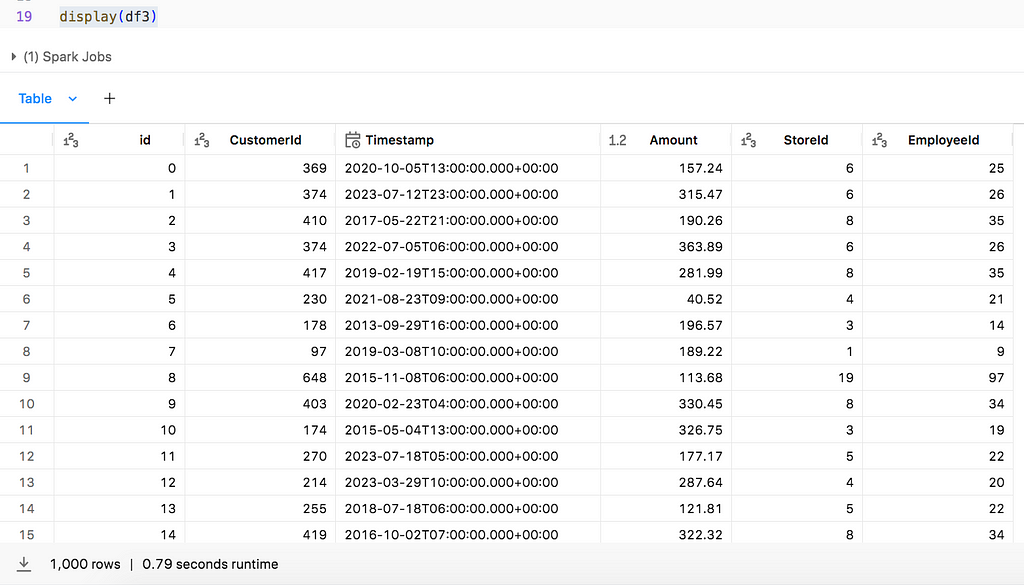
Our new scripts looks as follows:
https://medium.com/media/0637493d35285e5e960557956c07ab6e/hrefhttps://medium.com/media/1fb4045e2ea95a78910da70d0ee5dc0f/href
Adding Randomness to the customers
What we now need is a bit of randomness, which we need to define. For our example, let’s say that each customer has a 90% chance of shopping at the usual store (the “local” store). If we do not need all customers to be returned in the results set, we can simply adjust our customers_udf as follows, and use df2:
https://medium.com/media/3bfdda7d48a67575403095322d4782eb/href
The logic involves using the random.choices function to supply a weighted list and return a single value.
To compute the weighted list, we have the weight of our “local” store for the customer, in this case 90%, so need to assign the remaining 10% to the other stores, in this case 19 stores. The probability of each other store being selected will therefore be 10/19 = 0.526%. We can populate an array with these percentages, which would look something like the following:[0.526,0.526,0.526,…,90,0.526,…0.526]
Passing this into random.choices, we then randomly select a store Id from the list with the corresponding weights and use this as the input for the customer_id variable, as before.
Note: The output of random.choices returns a list (as you can request k results), so access the 0th element of the list to get the store_id as an integer value.
If we need to combine this logic with a DataFrame including all customers, we can reverse the process slightly. The weights logic is still valid so we can just plug this into randomly select a store and return this as the result:
https://medium.com/media/ead16819022b7f36be7f734b577bf9fa/href
Conclusion
There we have it! A synthetically created DataFrame with both strict and loose mappings between columns. You can now progress the next steps to populate related tables which may contain more descriptive information, such as dimension tables of store names, addresses, employee names, roles, etc. This can also be done using Databricks Labs Data Generator or any other tool/process you are comfortable with.
There are some great examples on the Databricks Labs Data Generator GitHub Repo along with documentation, so please do take a look at this if you are curious to learn more.
All of my code can be accessed from the following GitHub Repo.
If you have any thoughts, comments or alternatives to this demo, please reach out in the comments. Thanks!
Create Many-To-One relationships Between Columns in a Synthetic Table with PySpark UDFs was originally published in Towards Data Science on Medium, where people are continuing the conversation by highlighting and responding to this story.
Leverage some simple equations to generate related columns in test tables.

I’ve recently been playing around with Databricks Labs Data Generator to create completely synthetic datasets from scratch. As part of this, I’ve looked at building sales data around different stores, employees, and customers. As such, I wanted to create relationships between the columns I was artificially populating — such as mapping employees and customers to a certain store.
Through using PySpark UDFs and a bit of logic, we can generate related columns which follow a many-to-one relationship. With a bit of magic, we are even able to extend the logic to give some variance in this mapping — like a customer generally buying from their local store but sometimes from a different store.
Use Databricks Labs Data Generator to generate our basic DataFrame
Note: You can skip this section if not required!
First up, we need to create a DataFrame with our first randomly-generated column. In our case, we’re going to start with the store, as logically we will have “many employees per store” and “many customers repeatedly shopping at a store”.
With a Star Schema Data Model in mind, we’re going to start with our Sales Fact table — a transactional table which will contain key values for the Sale Id, Store Id, Employee Id and Customer Id, the Sale Amount along with some datetime data for the purchase. We can then fill out the specifics about the Store, Employee and Customer in dimension tables further down the line.
We’ll start small — a table with 1000 sales will do. We now need to decide how to split these sales up between stores, employees and customers. Let’s suggest the following:
- # Stores = 20
- # Employees = 100
- # Customers = 700
We can also say that the sales will be recorded over the course of last month:
- First Sale Date = 2023–11–01
- Last Sale Date = 2023–11–30
The Sale Id needs to be a unique column so we can generate an Id column for this. We now need to distribute the 1000 sales across the 20 stores. For simplicity we will assume this is random.
Using Databricks Lab Generator we can do this with the following code:
https://medium.com/media/1dbbf19e973a3afea5526d7c613ffc8d/hrefhttps://medium.com/media/b66c9f36f7f8e0378e89d2839eab7dfa/hrefhttps://medium.com/media/87284680b5d1453a517dc9ba491d5169/href
Now add some code to record when the sales were made and their amount. To keep things simple, we’ll round the timestamp of the sale to the nearest hour.
https://medium.com/media/7a068c3c2af10db25a149bc117aa9831/href
To calculate the sale amount, we can use the “expr” parameter in our withColumn expression to allow us to generate a random number, with some rules/boundaries.
https://medium.com/media/527be3b6e46203b82d69b71f3e118c05/href
In this case, the expression is quite straight-forward: produce a random number (between 0 and 1), add 0.1 (ensuring sale values are not 0) and multiply by 350.
We’ve got our basic shape for the DataFrame now, so put it all together:
https://medium.com/media/0dcda45fd358954946a751d2277a66d3/href
We can create a quick Data Profile to look at the distribution of values in the columns:
We can see that the StoreId distribution is relatively even across the 20 stores, with no missing values and averages around the centre as we would expect. The same follows for the Timestamps and amount values.
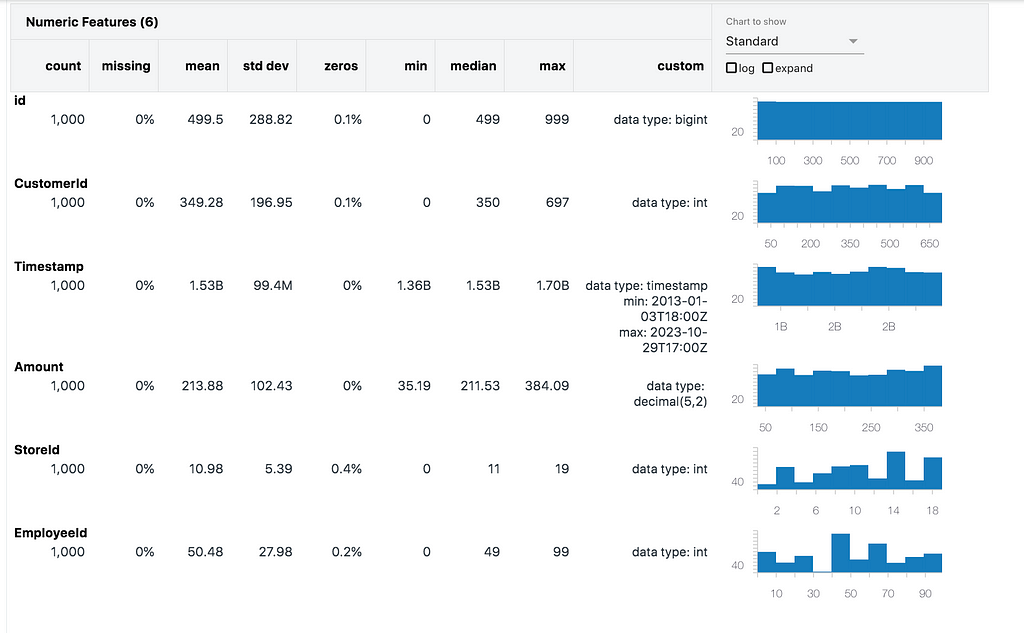
Add a dependent Many-To-One column
Now we can add our Employee Id column to the DataFrame. We’re done with Databricks Lab Data Generator now, so will just use PySpark operations to add columns to the DataFrame.
Stepping back from the code, we want to model this as the following statements:
- There are 20 stores.
- Each store has more than 1 employee.
- Each employee works at a single store only.
First we need to split the employees between the stores. The following python function can be used to do so:
https://medium.com/media/ccc1120174ff30fa5f4b3fbc78243d85/href
Now that we have our distribution of employees for each store, let’s start assigning Ids!
The employeesPerStore list ensures that the employee Ids per store do not overlap. We can use this to randomly assign an employee Id to a sale in the table with the following equation:
https://medium.com/media/de106d99c7675d2dcadbaa794a484ca3/href
This function currently only works for a single value — we need to put this into something that a PySpark DataFrame can work with (functionally, and quickly!)
We can pass PySpark UDFs to the withColumn method, so let’s reformat this logic into a function and set it to a UDF:
https://medium.com/media/5061f4dc681c9a78a07158aa452cd14d/href
Now call this as a new column in the DataFrame:
https://medium.com/media/c0ab8deeb651ff670c54ce53e136881e/href
We can quickly test this looks correct by using the Visualisation tool in Databricks to see the distinct count of Employee Ids per Store Id. This is my preference but you could also use group by logic or other plotting modules, if desired.
Important Note: This logic allows for employees to be missed from the results. This means that it is possible for an employee to make 0 sales, and thus not be included in the DataFrame. We’ll look at how to ensure all customers have sales recorded against them in the next section.
Add the customers column
The customers column is a bit different… while our use-case suggests it is common for a customer to shop at a single store multiple times, it is entirely possible that they got to a different store one day. How do we model this?
We’ve got the starting points with the work done for our employees column, so can repeat the get_employees function and UDF logic for customers as below:
https://medium.com/media/38ba0fef63c1b950c9dc9ffe815daa94/href
We’ve again potentially missed a few customers off here. Here are a few approaches to rectify this:
- Recalculate in while loop until you converge on a DataFrame which contains all customers (inefficient, costly, could run indefinitely)
- Randomly update customer Ids in while loop until all customers in DataFrame (requires logic to only overwrite same stores, could also run indefinitely)
- Return a list of all customer Ids with more than 1 record in the sales table, and randomly overwrite until all missing Ids are added (also needs logic for overwriting customers in same store, may also require while loop logic)
- Reverse the process and start with employees. This ensures each employee is randomly assigned to rows. We can then use the mapping and apply the store Id.
Hopefully it is clear why the last option is the lowest effort to compute — we have all the code required so just need to reformat things slightly.
Our new scripts looks as follows:
https://medium.com/media/0637493d35285e5e960557956c07ab6e/hrefhttps://medium.com/media/1fb4045e2ea95a78910da70d0ee5dc0f/href
Adding Randomness to the customers
What we now need is a bit of randomness, which we need to define. For our example, let’s say that each customer has a 90% chance of shopping at the usual store (the “local” store). If we do not need all customers to be returned in the results set, we can simply adjust our customers_udf as follows, and use df2:
https://medium.com/media/3bfdda7d48a67575403095322d4782eb/href
The logic involves using the random.choices function to supply a weighted list and return a single value.
To compute the weighted list, we have the weight of our “local” store for the customer, in this case 90%, so need to assign the remaining 10% to the other stores, in this case 19 stores. The probability of each other store being selected will therefore be 10/19 = 0.526%. We can populate an array with these percentages, which would look something like the following:[0.526,0.526,0.526,…,90,0.526,…0.526]
Passing this into random.choices, we then randomly select a store Id from the list with the corresponding weights and use this as the input for the customer_id variable, as before.
Note: The output of random.choices returns a list (as you can request k results), so access the 0th element of the list to get the store_id as an integer value.
If we need to combine this logic with a DataFrame including all customers, we can reverse the process slightly. The weights logic is still valid so we can just plug this into randomly select a store and return this as the result:
https://medium.com/media/ead16819022b7f36be7f734b577bf9fa/href
Conclusion
There we have it! A synthetically created DataFrame with both strict and loose mappings between columns. You can now progress the next steps to populate related tables which may contain more descriptive information, such as dimension tables of store names, addresses, employee names, roles, etc. This can also be done using Databricks Labs Data Generator or any other tool/process you are comfortable with.
There are some great examples on the Databricks Labs Data Generator GitHub Repo along with documentation, so please do take a look at this if you are curious to learn more.
All of my code can be accessed from the following GitHub Repo.
If you have any thoughts, comments or alternatives to this demo, please reach out in the comments. Thanks!
Create Many-To-One relationships Between Columns in a Synthetic Table with PySpark UDFs was originally published in Towards Data Science on Medium, where people are continuing the conversation by highlighting and responding to this story.
Denial of responsibility! Techno Blender is an automatic aggregator of the all world’s media. In each content, the hyperlink to the primary source is specified. All trademarks belong to their rightful owners, all materials to their authors. If you are the owner of the content and do not want us to publish your materials, please contact us by email – [email protected]. The content will be deleted within 24 hours.