
Data Science to Implement a Circular Economy
How can you use Data Science to support a Fast Fashion Retailer in Implementing a Circular Economy?
A circular economy is an economic system in which resources are used, reused or recycled in a closed loop instead of being extracted and discarded as waste.
What happens to the old clothes you return to your favourite fast-fashion retail store?
The aim is to maximize resource use and regenerate products or materials at the end of each life cycle.
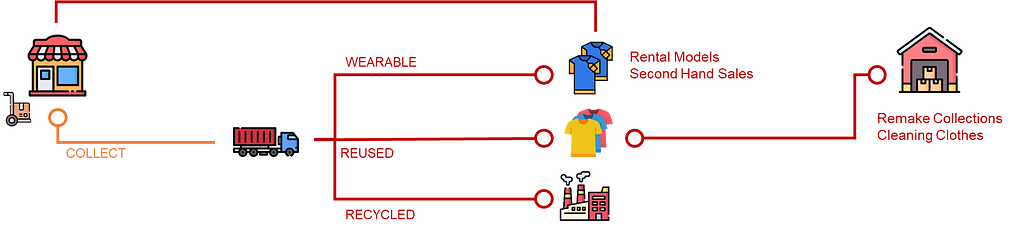
They are collected and sorted into three different categories
- Wearable clothes: These will be resold as second-hand clothing.
- Reused Clothes: These will be turned into other products, such as “remake collections” or cleaning clothes.
- Recycle clothes: These will be shredded into textile fibres and used to make insulation materials.
As a Data Science Manager, how can you support your company's transition to a circular economy?
This requires a major transformation of your logistics and supply chain operations to include these processes in the value chain.
In this article, we will see how you can use data science to support a transition to a circular economy by providing monitoring, diagnostic and optimization tools.
What is a Circular Economy?
Data Science to Support the Green Transformation
You are a data science manager in the logistics department of an international clothing group with stores worldwide.
The company produces garments, bags, and accessories in factories in Asia.
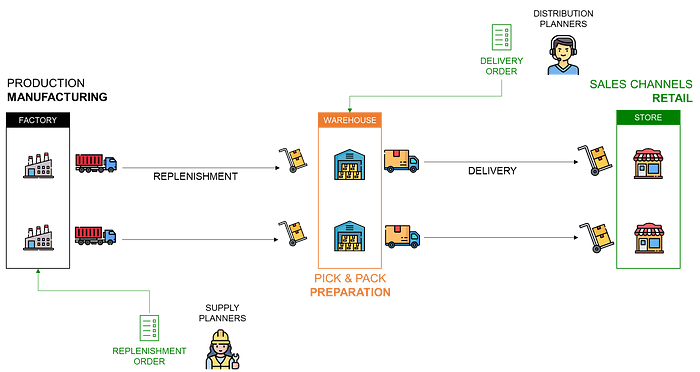
These factories deliver central warehouses that replenish the stores.
Last year, your CEO made a public commitment to support the United Nations Sustainable Development Goals with a strong focus on the planet's goals.

Therefore, the sustainability team is preparing a roadmap for carbon footprint reduction by 2030.
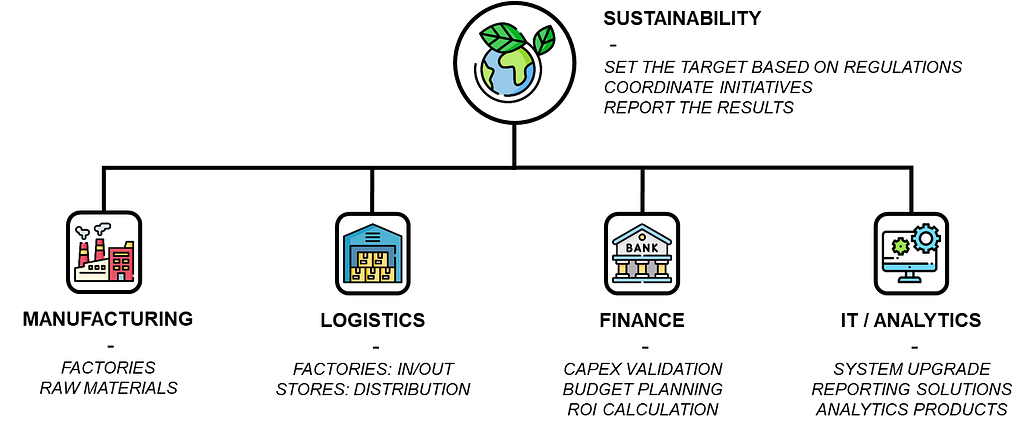
A project team has been formed, including experts from the operations department (manufacturing and logistics), finance managers and IT experts.
As a Data Science manager, your role is to provide analytics solutions for the logistics department's implementation challenges in its transformation.
A Transformation of the Distribution Network
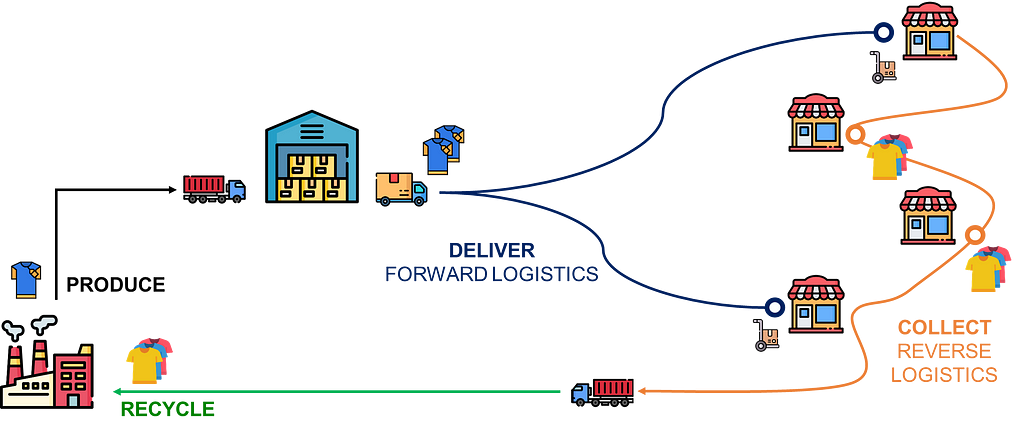
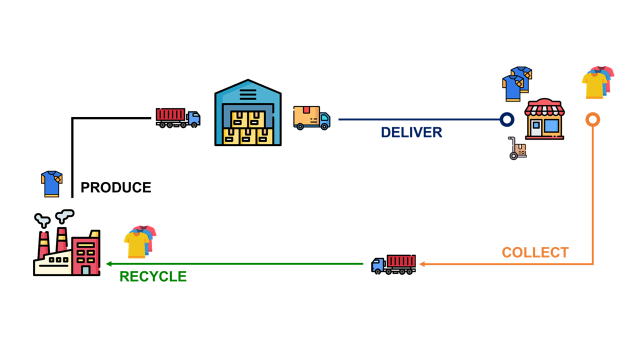
A complete reshuffle of the distribution network is needed to include this reverse flow.
The objective is to implement a set of processes to
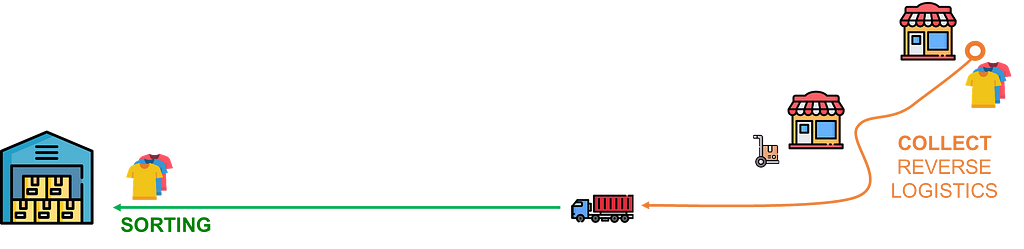
- Provide customers with the option to drop off used clothes in “collecting boxes” at the stores.
- Organize the transfer of these boxes to a central warehouse.
- Implement processes at the warehouse to sort the items into the three categories for further processing.
As the focus here will be on logistics management, we will not enter into the details of the recycling processes.
How can you support (with data) the design and implementation of these solutions?
Your mission is to design advanced analytics tools to monitor operational KPIs and optimize processes.
In the next section, we will detail the operational challenges the organization may face when implementing these process changes.
Data Science to Support the Operations
You have worked with the logistics teams for years to implement reporting and optimization tools for forward logistics.
To prepare for the transition to a circular economy, they have additional requests to manage collection and sorting processes.
What are the additional processes that we need to monitor and optimize?
In this section, we will briefly cover several examples of process design requirements with the associated analytics solutions.
Descriptive Analytics: Product tracking and traceability
Because of regulations, you must ensure that products are used and processed in the most sustainable way possible.
Therefore, the logistic teams need to be able to track and trace products throughout their lifecycle.
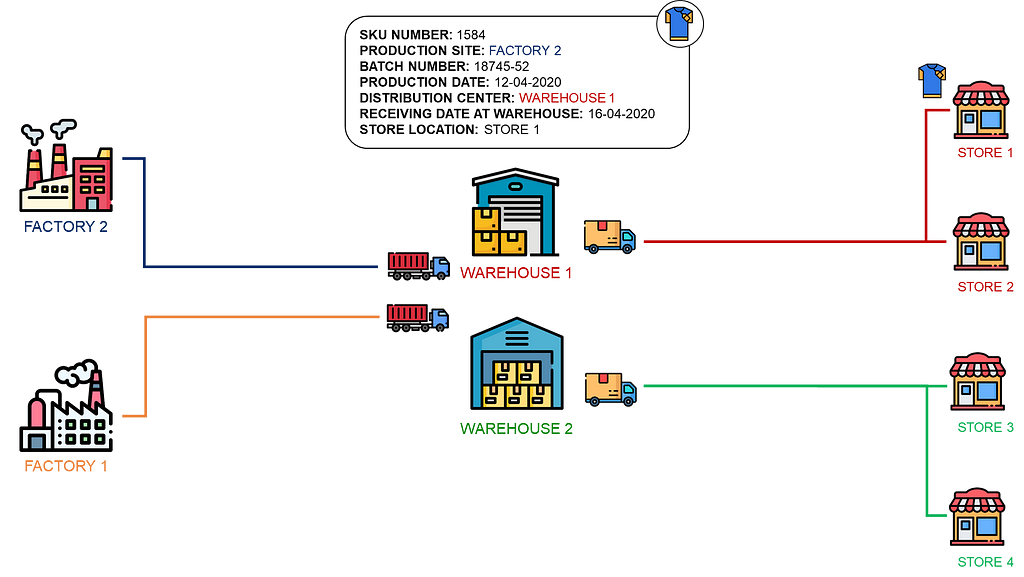
For forward logistics, products are tracked from the factory to the store
- Master data databases will include (Stock Keeping Unit) SKU Number, product information (size, colour, packaging)
- Production Systems can provide the batch number (useful if you need to call items), production date and factory location.
- Warehouse and Transportation Management can track the product along the logistics chain, from warehouse receiving to store delivery.
How can you support the tracking of returned items with advanced analytics?
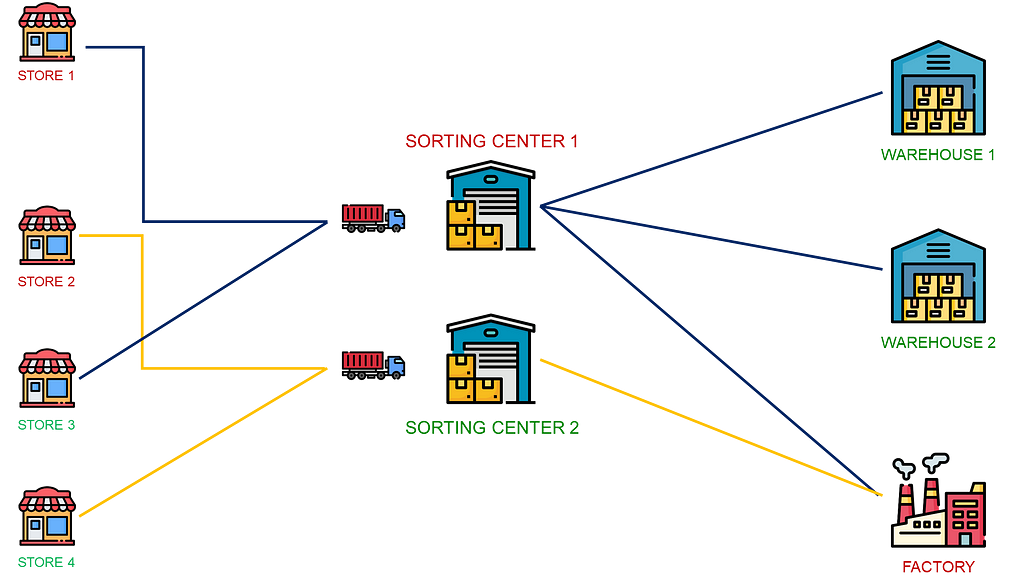
For reverse logistics, the logistics request your support in monitoring the flow of “returned” products from the collection box to the sorting centre.

Different logistics systems that are recording transactional data can be used as data sources to build automated flow monitoring tools:
- Enterprise Ressource Planning (ERP) records the customer returns at the store with Store Location, SKU ID, Quantity, Collection Box ID and Collection Time.
- Transportation Management Systems records the pick-up of collection boxes, including store location, collection box ID and collection time.
- Warehouse Management Systems tracks the items from receipt to the end of the sorting process with the SKU ID, Collection Box, Receiving Time, End of Sorting Time, and Final Destination.
Business Intelligence methodologies using a central data warehouse can support the creation of harmonized tracking data sources that can be used for audits or reporting.
If you need more details on how to implement it, have a look at this article.
What is Business Intelligence?
Now that you have provided transparency to the operations, let’s focus on process optimization.
Prescriptive Analytics: Sorting Network Design
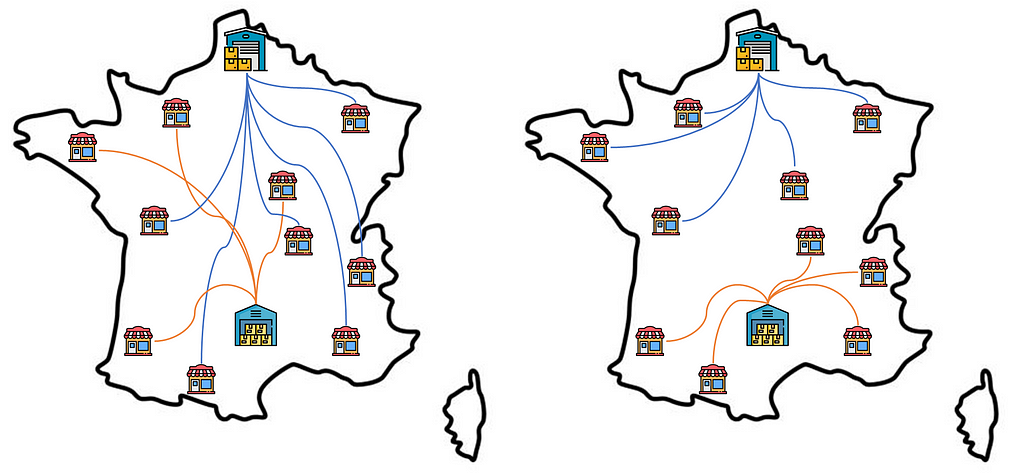
The logistic teams would like to design a network of sorting centres that minimizes the environmental impact of the reverse flow.
The optimal network may differ from the current one as you need to collect items after sales and reintroduce recycled materials into the chain.
They shared with you
- A list of potential sorting locations with their capacity (Units/Day)
- Forecasts of reverse flow volumes from the stores (Units/Day)
Question: Where should we place the sorting centers to minimize costs and CO2 emissions?
This will remind you of the Supply Chain Network Optimization Problem for which you need to design a network of factories.
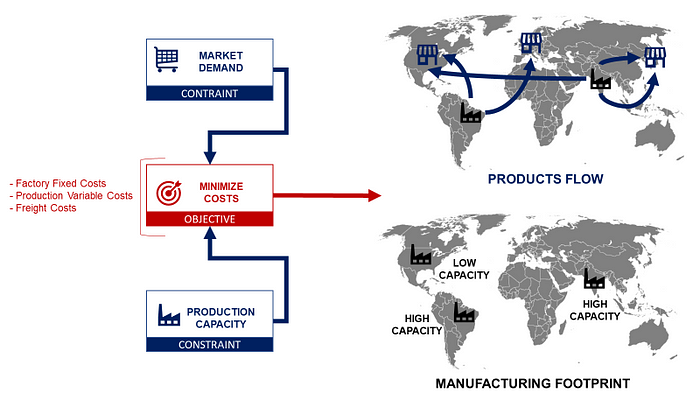
The market demand must be fulfilled by factories with limited capacities and different costs to produce and deliver goods.
Linear programming is used to select the right factories that minimize the overall costs while respecting a set of constraints.
For more details, have a look at this detailed example
Robust Supply Chain Network with Monte Carlo Simulation
How can we adapt this solution to the sorting network design problem?
This can be easily adapted to this new problem
- Demand => Units Collected from the Stores (Units/Day).
- Factories Capacity => Sorting Capacity of each Centre (Units/Day).
You can then select the optimal set of sorting locations depending on the objective you have
- Minimizing the total costs?
The algorithm will consider the transportation costs (from the stores to each sorting location) and the sorting costs of each centre. - Minimize the CO2 emissions?
The algorithm will try to minimize the distance from the store to the selected centres.
Now that you have selected the optimal set of sorting centres, you can organize the reverse flow.
Prescriptive Analytics: Reverse Flow Optimization
The transportation team requests your support in designing a tool to allocate the right sorting centre to each store.
Indeed, as the volumes and capacities evolve, you’d better dynamically allocate a sorting centre to each store on a weekly or daily basis.
Question: For each store i, which centre should sort the returned items to minimize the transportation costs?
In a previous article, I tackled a similar problem: The Supply Planning Problem.
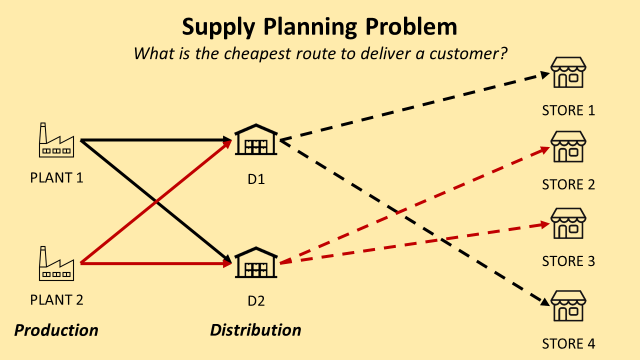
Several factories replenish distribution centres that store goods and deliver stores.
To answer this problem, we also use linear programming to
- Optimize upstream flows from the factories to the distribution centres
- Deliver each store from the right warehouse
This solution can be used after slight adaptations
- Define (or forecast) the volumes from the sorting centres to the final recycling location
- Define the capacity of each sorting centre
You can then follow the approach (and use the code) detailed in this article.
Supply Planning using Linear Programming with Python
Now that we have designed the network of sorting locations and developed a tool to optimize reverse flows, we can work on performance monitoring.
Implementation of Analytics Solutions
How can you implement analytics capabilities?
A Supply Chain can be defined as several parties exchanging flows of material, information, or money resources to fulfil a customer request.
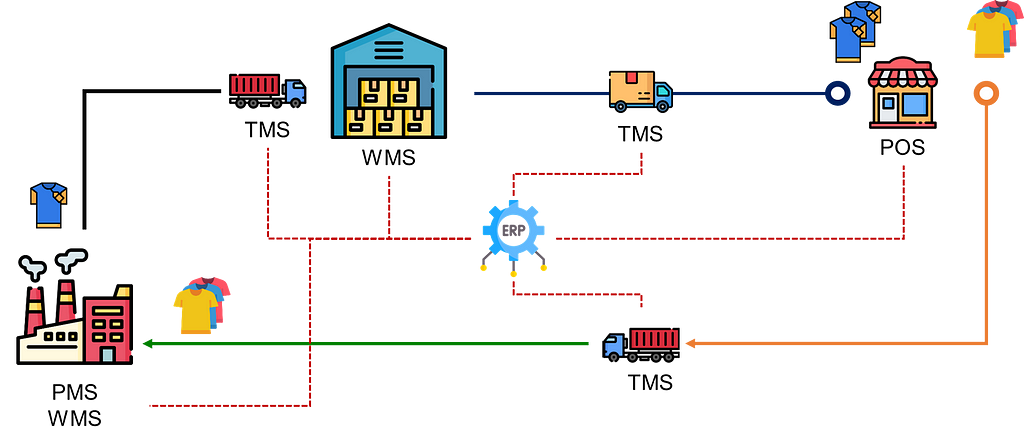
To exchange and store information, these parties use different systems:
- Transportation Management Systems (TMS),
- Point-of-sale (POS) Systems to manage sales data
- Warehouse and Production Management Systems
They are connected to a central Enterprise Ressources Planning (ERP) system that centralizes the end-to-end operations.
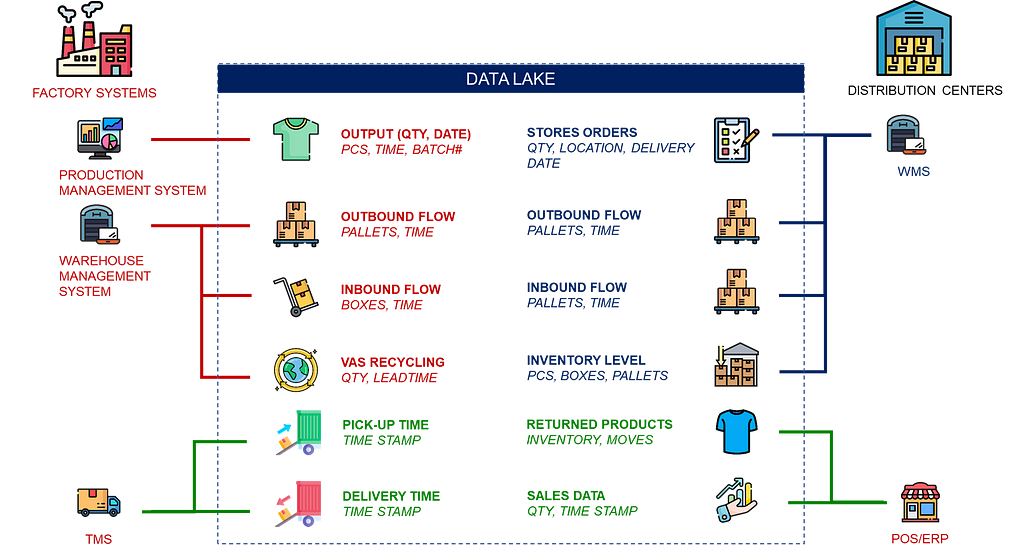
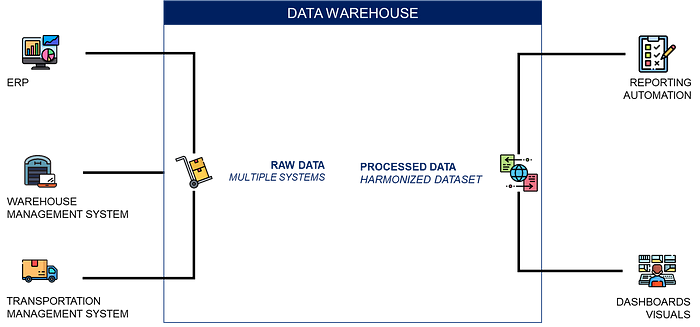
These systems can be included in a data architecture to collect, process and analyze transactional data from multiple sources.
This central source of harmonized and clean data can be used to
- Deploy the analytics products introduced in the previous section.
- Implement performance indicators to monitor the “health” of your reverse flow.
Implement Performance Indicators
Logistics management would need to be able to visualise a set of metrics to track the progress of the circular economy implementation and make adjustments if needed.
They would like to track Key Performance Indicators (KPIs) for
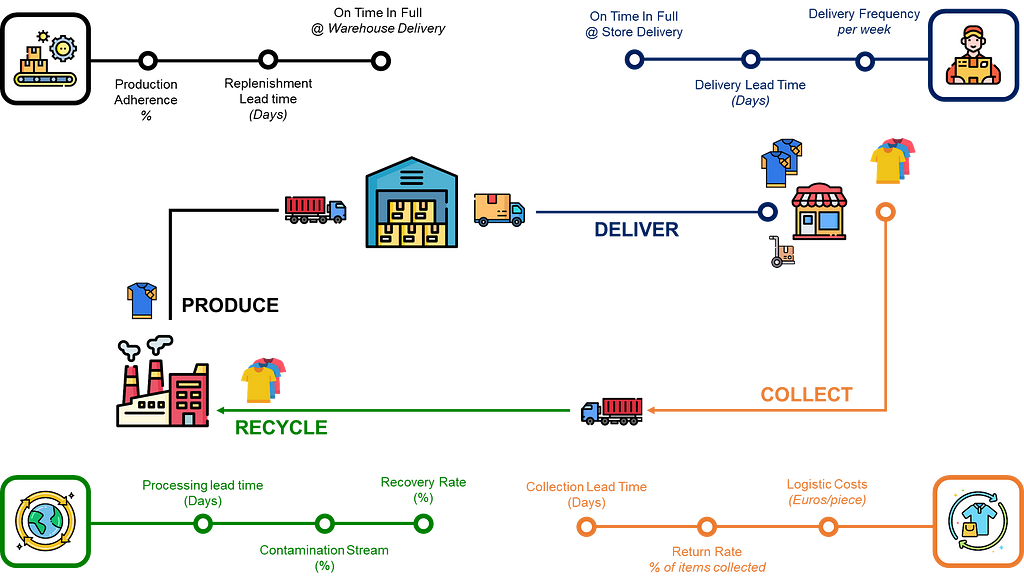
Logistics Performance
- Replenishment, delivery and collection lead times
- Warehouse and transportation costs per piece
- On Time In Full (OTIF) at warehouse and store delivery
These metrics, focusing on the performance of your collection network, can be collected from Warehouse and Transportation management systems.
Additional KPIs related to recycling processes (Not in the scope of this article) can be added to measure
- Production adherence: % of quantity produced / quantity planned
- Recovery rate: % of recyclable materials that are successfully recovered
- Contamination rate: % of non-recyclable materials found in the stream
- Processing lead time: The time and resources required to process a given amount of collected materials.
Following the methodologies and solutions presented in this section, you have the right solution to monitor and optimise processes supporting a circular economy.
Conclusion
These additional constraints would require effort and resources to transform organizations.
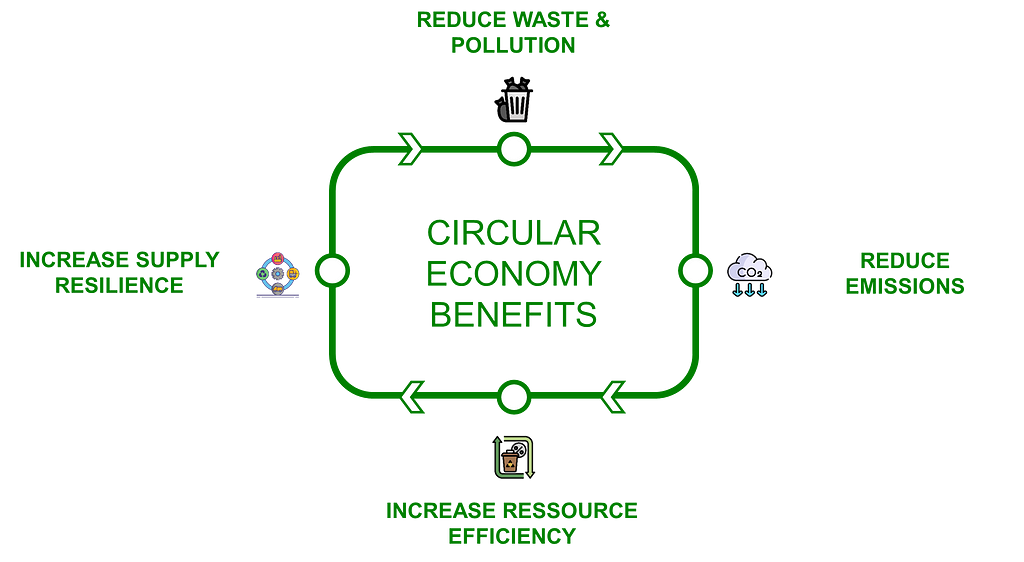
However, there are several environmental benefits that a fashion retail company could achieve by implementing circular economy principles.
- Reduced waste and pollution to comply with future regulations
- Decrease greenhouse gas emissions to meet targets
- Increased resilience by reducing your dependence on finite resources and multiplying sources of raw materials supply with recycling
Therefore, the different advanced analytics tools you may develop can become strategic assets for your organization.
About Me
Let’s connect on Linkedin and Twitter. I am a Supply Chain Engineer using data analytics to improve logistics operations and reduce costs.
If you are interested in data analytics and supply chain, please visit my website.
Samir Saci | Data Science & Productivity
💡 Follow me on Medium for more articles related to 🏭 Supply Chain Analytics, 🌳 Sustainability and 🕜 Productivity.
Data Science to Implement a Circular Economy was originally published in Towards Data Science on Medium, where people are continuing the conversation by highlighting and responding to this story.
How can you use Data Science to support a Fast Fashion Retailer in Implementing a Circular Economy?
A circular economy is an economic system in which resources are used, reused or recycled in a closed loop instead of being extracted and discarded as waste.
What happens to the old clothes you return to your favourite fast-fashion retail store?
The aim is to maximize resource use and regenerate products or materials at the end of each life cycle.
They are collected and sorted into three different categories
- Wearable clothes: These will be resold as second-hand clothing.
- Reused Clothes: These will be turned into other products, such as “remake collections” or cleaning clothes.
- Recycle clothes: These will be shredded into textile fibres and used to make insulation materials.
As a Data Science Manager, how can you support your company's transition to a circular economy?
This requires a major transformation of your logistics and supply chain operations to include these processes in the value chain.
In this article, we will see how you can use data science to support a transition to a circular economy by providing monitoring, diagnostic and optimization tools.
What is a Circular Economy?
Data Science to Support the Green Transformation
You are a data science manager in the logistics department of an international clothing group with stores worldwide.
The company produces garments, bags, and accessories in factories in Asia.
These factories deliver central warehouses that replenish the stores.
Last year, your CEO made a public commitment to support the United Nations Sustainable Development Goals with a strong focus on the planet's goals.
Therefore, the sustainability team is preparing a roadmap for carbon footprint reduction by 2030.
A project team has been formed, including experts from the operations department (manufacturing and logistics), finance managers and IT experts.
As a Data Science manager, your role is to provide analytics solutions for the logistics department's implementation challenges in its transformation.
A Transformation of the Distribution Network
A complete reshuffle of the distribution network is needed to include this reverse flow.
The objective is to implement a set of processes to
- Provide customers with the option to drop off used clothes in “collecting boxes” at the stores.
- Organize the transfer of these boxes to a central warehouse.
- Implement processes at the warehouse to sort the items into the three categories for further processing.
As the focus here will be on logistics management, we will not enter into the details of the recycling processes.
How can you support (with data) the design and implementation of these solutions?
Your mission is to design advanced analytics tools to monitor operational KPIs and optimize processes.
In the next section, we will detail the operational challenges the organization may face when implementing these process changes.
Data Science to Support the Operations
You have worked with the logistics teams for years to implement reporting and optimization tools for forward logistics.
To prepare for the transition to a circular economy, they have additional requests to manage collection and sorting processes.
What are the additional processes that we need to monitor and optimize?
In this section, we will briefly cover several examples of process design requirements with the associated analytics solutions.
Descriptive Analytics: Product tracking and traceability
Because of regulations, you must ensure that products are used and processed in the most sustainable way possible.
Therefore, the logistic teams need to be able to track and trace products throughout their lifecycle.
For forward logistics, products are tracked from the factory to the store
- Master data databases will include (Stock Keeping Unit) SKU Number, product information (size, colour, packaging)
- Production Systems can provide the batch number (useful if you need to call items), production date and factory location.
- Warehouse and Transportation Management can track the product along the logistics chain, from warehouse receiving to store delivery.
How can you support the tracking of returned items with advanced analytics?
For reverse logistics, the logistics request your support in monitoring the flow of “returned” products from the collection box to the sorting centre.
Different logistics systems that are recording transactional data can be used as data sources to build automated flow monitoring tools:
- Enterprise Ressource Planning (ERP) records the customer returns at the store with Store Location, SKU ID, Quantity, Collection Box ID and Collection Time.
- Transportation Management Systems records the pick-up of collection boxes, including store location, collection box ID and collection time.
- Warehouse Management Systems tracks the items from receipt to the end of the sorting process with the SKU ID, Collection Box, Receiving Time, End of Sorting Time, and Final Destination.
Business Intelligence methodologies using a central data warehouse can support the creation of harmonized tracking data sources that can be used for audits or reporting.
If you need more details on how to implement it, have a look at this article.
What is Business Intelligence?
Now that you have provided transparency to the operations, let’s focus on process optimization.
Prescriptive Analytics: Sorting Network Design
The logistic teams would like to design a network of sorting centres that minimizes the environmental impact of the reverse flow.
The optimal network may differ from the current one as you need to collect items after sales and reintroduce recycled materials into the chain.
They shared with you
- A list of potential sorting locations with their capacity (Units/Day)
- Forecasts of reverse flow volumes from the stores (Units/Day)
Question: Where should we place the sorting centers to minimize costs and CO2 emissions?
This will remind you of the Supply Chain Network Optimization Problem for which you need to design a network of factories.
The market demand must be fulfilled by factories with limited capacities and different costs to produce and deliver goods.
Linear programming is used to select the right factories that minimize the overall costs while respecting a set of constraints.
For more details, have a look at this detailed example
Robust Supply Chain Network with Monte Carlo Simulation
How can we adapt this solution to the sorting network design problem?
This can be easily adapted to this new problem
- Demand => Units Collected from the Stores (Units/Day).
- Factories Capacity => Sorting Capacity of each Centre (Units/Day).
You can then select the optimal set of sorting locations depending on the objective you have
- Minimizing the total costs?
The algorithm will consider the transportation costs (from the stores to each sorting location) and the sorting costs of each centre. - Minimize the CO2 emissions?
The algorithm will try to minimize the distance from the store to the selected centres.
Now that you have selected the optimal set of sorting centres, you can organize the reverse flow.
Prescriptive Analytics: Reverse Flow Optimization
The transportation team requests your support in designing a tool to allocate the right sorting centre to each store.
Indeed, as the volumes and capacities evolve, you’d better dynamically allocate a sorting centre to each store on a weekly or daily basis.
Question: For each store i, which centre should sort the returned items to minimize the transportation costs?
In a previous article, I tackled a similar problem: The Supply Planning Problem.
Several factories replenish distribution centres that store goods and deliver stores.
To answer this problem, we also use linear programming to
- Optimize upstream flows from the factories to the distribution centres
- Deliver each store from the right warehouse
This solution can be used after slight adaptations
- Define (or forecast) the volumes from the sorting centres to the final recycling location
- Define the capacity of each sorting centre
You can then follow the approach (and use the code) detailed in this article.
Supply Planning using Linear Programming with Python
Now that we have designed the network of sorting locations and developed a tool to optimize reverse flows, we can work on performance monitoring.
Implementation of Analytics Solutions
How can you implement analytics capabilities?
A Supply Chain can be defined as several parties exchanging flows of material, information, or money resources to fulfil a customer request.
To exchange and store information, these parties use different systems:
- Transportation Management Systems (TMS),
- Point-of-sale (POS) Systems to manage sales data
- Warehouse and Production Management Systems
They are connected to a central Enterprise Ressources Planning (ERP) system that centralizes the end-to-end operations.
These systems can be included in a data architecture to collect, process and analyze transactional data from multiple sources.
This central source of harmonized and clean data can be used to
- Deploy the analytics products introduced in the previous section.
- Implement performance indicators to monitor the “health” of your reverse flow.
Implement Performance Indicators
Logistics management would need to be able to visualise a set of metrics to track the progress of the circular economy implementation and make adjustments if needed.
They would like to track Key Performance Indicators (KPIs) for
Logistics Performance
- Replenishment, delivery and collection lead times
- Warehouse and transportation costs per piece
- On Time In Full (OTIF) at warehouse and store delivery
These metrics, focusing on the performance of your collection network, can be collected from Warehouse and Transportation management systems.
Additional KPIs related to recycling processes (Not in the scope of this article) can be added to measure
- Production adherence: % of quantity produced / quantity planned
- Recovery rate: % of recyclable materials that are successfully recovered
- Contamination rate: % of non-recyclable materials found in the stream
- Processing lead time: The time and resources required to process a given amount of collected materials.
Following the methodologies and solutions presented in this section, you have the right solution to monitor and optimise processes supporting a circular economy.
Conclusion
These additional constraints would require effort and resources to transform organizations.
However, there are several environmental benefits that a fashion retail company could achieve by implementing circular economy principles.
- Reduced waste and pollution to comply with future regulations
- Decrease greenhouse gas emissions to meet targets
- Increased resilience by reducing your dependence on finite resources and multiplying sources of raw materials supply with recycling
Therefore, the different advanced analytics tools you may develop can become strategic assets for your organization.
About Me
Let’s connect on Linkedin and Twitter. I am a Supply Chain Engineer using data analytics to improve logistics operations and reduce costs.
If you are interested in data analytics and supply chain, please visit my website.
Samir Saci | Data Science & Productivity
💡 Follow me on Medium for more articles related to 🏭 Supply Chain Analytics, 🌳 Sustainability and 🕜 Productivity.
Data Science to Implement a Circular Economy was originally published in Towards Data Science on Medium, where people are continuing the conversation by highlighting and responding to this story.
Denial of responsibility! Techno Blender is an automatic aggregator of the all world’s media. In each content, the hyperlink to the primary source is specified. All trademarks belong to their rightful owners, all materials to their authors. If you are the owner of the content and do not want us to publish your materials, please contact us by email – [email protected]. The content will be deleted within 24 hours.