
DIGITOUR: Automatic Digital Tours for Real-Estate Properties
An Automated Pipeline for Creating 3D Experiences from Equirectangular Images
1. Introduction
The demand for online real-estate tools has increased drastically due to the ease of accessibility to the Internet, especially in countries like India. There are many online real-estate platforms for owners, developers, and real-estate brokers to post properties for buying and renting purposes. Daily, these platforms receive 8,000 to 9,000 new listings. Until now, the users on these platforms view images, snapshots, or videos, which may not build the desired confidence to decide and finalize the deal. To overcome this challenge and to enhance user experience, virtual tours are a potential solution.
Virtual tours are images linked together, allowing viewers to experience a particular location remotely (a frequently used example is Google Street View [1]). Recently, the demand for virtual tours has increased as they provide better interaction with users/customers, especially in businesses like real-estate, hotels, restaurants, universities, schools, etc [2]. Broadly, there are three categories of virtual tours:
- 2D video tours,
- 360◦ video-based virtual tours, and
- 360◦ static image-based virtual tours.
Compared to 2D video tours and 360◦ video-based tours, the static equirectangular image-based virtual tours provide more immersion and interactivity, thus leading to better decision-making and avoiding unnecessary visits.
🚀 Before delving deep into the proposed work, I would like to mention that this work is published and available at the International Conference on Data Science & Management of Data (CODS-COMAD)— 2023. ✨✨✨
Typically, the pipeline for creating a virtual tour consists of the following components:
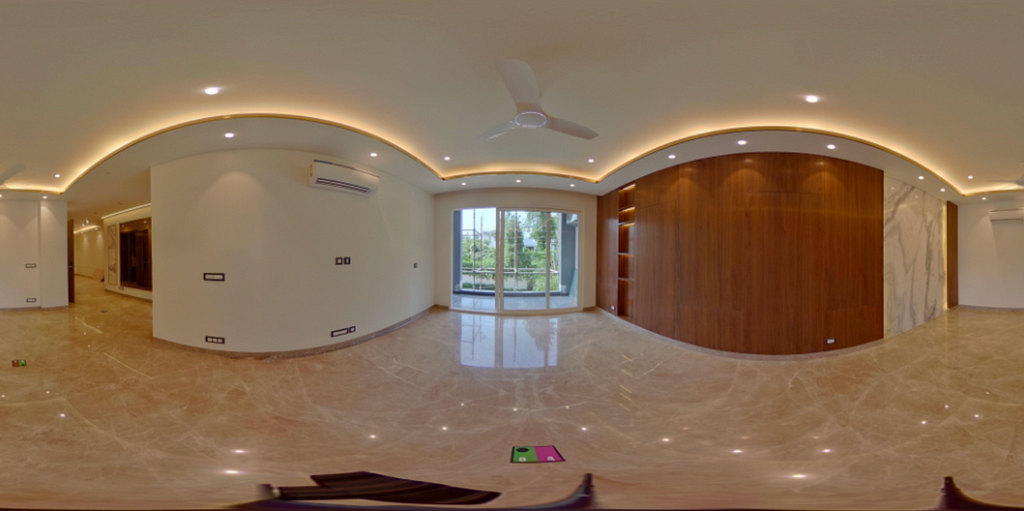
- Equirectangular Image Capture: An equirectangular image represents a spherical object as a 2D image (as shown in Figure 1). It is a spherical panorama incorporating 180° vertical and 360° horizontal viewing angles. A simple example can be the projection of Earth (a spherical-shaped object) on a 2D map. These images are clicked using 360◦ cameras such as Ricoh-Theta, Insta3602, etc.
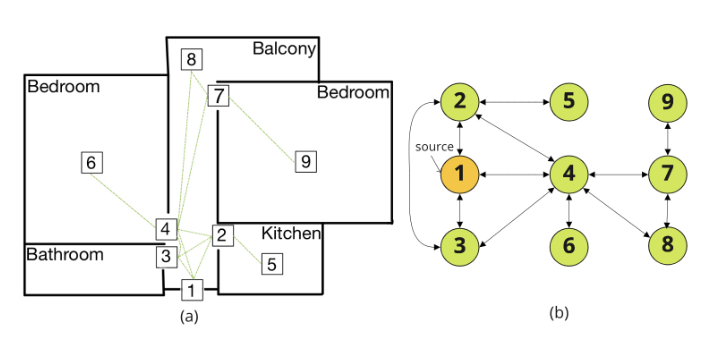
- Connecting Equirectangular Images: For any location, we will have multiple equirectangular images. To illustrate, in real estate properties, we typically have equilateral images for bedrooms, halls, kitchens, dining rooms, etc. It is essential to build navigation between images to have a complete “walkthrough” experience. Moreover, there can be multiple routes from one position to other positions. For instance, we can go from the hall to the kitchen, bedroom, balcony, etc. Therefore, it is crucial to connect all the equirectangular images (please refer to Figure 2 for an example). Generally, it is done manually, which is both costly and time-consuming [3].
- Publishing Virtual Tour: Once we have formed connections between equirectangular images, we can publish the final virtual tour on the cloud or in an application.
While automating the above pipeline, one of the significant challenges is the manual annotation for connecting equirectangular images. Generally, it takes more than 20 minutes to create a virtual tour. We propose an end-to-end pipeline for real-estate equirectangular images (called DIGITOUR) to overcome the challenge of creating automated digital tours. The DIGITOUR pipeline consists of the following components:
- Colored tag placement and clicking 360° images: We propose novel paper tags that are bi-colored and numbered, facilitating better learning of downstream computer vision tasks (i.e., tag recognition and digit recognition) and automatic stitching of equirectangular images.
- Map equirectangular images to cube map projection: We used the publicly available Python library vrProjector3 to map equirectangular images to their cube map projections (corresponding to six cube faces).
- Tag Detection: For each cube face, we propose colored tag detection in an image using YOLOv5 [4] architecture.
- Digit Recognition: We propose to perform digit recognition using a light-weight custom MobileNet [5] model.
Finally, we connect all the equirectangular images using the detected tags.
2. Proposed Pipeline: DIGITOUR
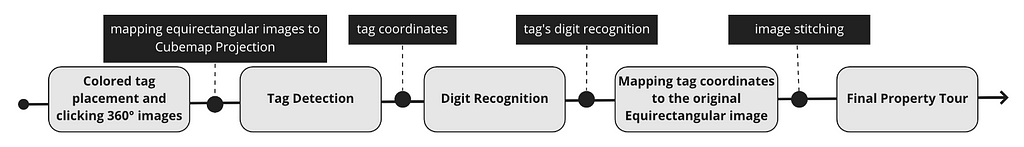
The complete pipeline for producing digital tours (referred to as DIGITOUR and shown in Figure 3) is as follows.
2.1 Tag Placement and Image Capturing
While creating a digital tour for any real-estate property, it is essential to click 360◦ images from different property locations such as bedroom, living room, kitchen, etc., then automatically stitching them together to have a “walkthrough” experience without being physically present at the location. Therefore, to connect multiple equirectangular images, we propose placing paper tags on the floor covering each location of the property, and placing the camera (in our case, we used Ricoh-Theta) in the middle of the scene to capture the whole site (front, back, left, right and bottom).
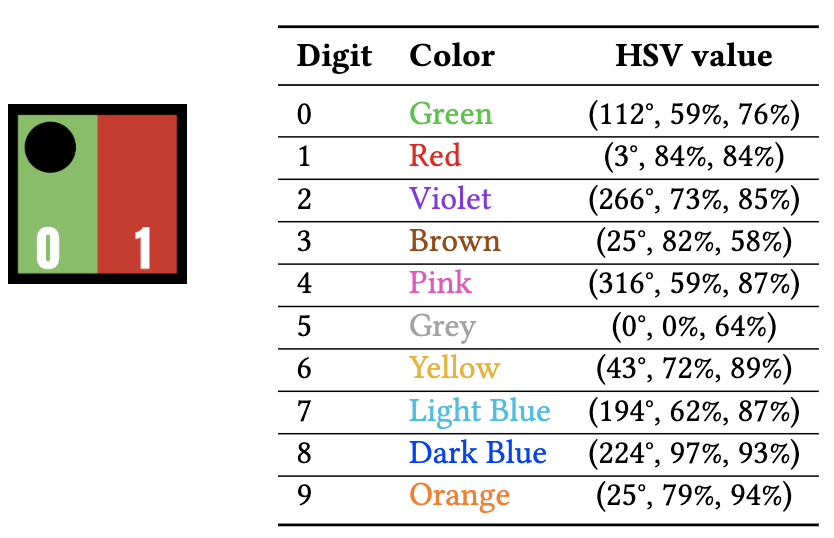
Moreover, we ensure that the scene is clear of all noisy elements such as dim lighting and ‘unwanted’ artifacts for better model training and inference. As shown in Figure 4, we have standardized the tags with dimensions of 6” × 6” with two properties:
- they are numbered which will help the photographer place tags in sequence and
- they are bi-colored to formulate the digit recognition problem as classification task and facilitate better learning of downstream computer vision tasks (i.e. tag detection and digit recognition).
Please note that different colors are assigned to each digit (from 0 to 9) using the HSV color scheme and leading digit of a tag has a black circle to distinguish it from the trailing digit as shown in Figure 4. The intuition behind standardizing the paper tags is that it allows to train tag detection and digit recognition models, which are invariant to distortions, tag placement angle, reflection from lighting sources, blur conditions, and camera quality.
2.2 Mapping Equirectangular Image to Cubemap Projection
An equirectangular image consists of a single image whose width and height correlate as 2 : 1 (as shown in Figure 1). In our case, images are clicked using a Ricoh-Theta camera having dimensions 4096 × 2048 × 3. Typically, each point in an equirectangular image corresponds to a point in a sphere, and the images are stretched in the ‘latitude’ direction. Since the contents of an equirectangular image are distorted, it becomes challenging to detect tags and recognize digits directly from it. For example, in Figure 1, the tag is stretched at the middle-bottom of the image. Therefore, it is necessary to map the image to a less-distorted projection and switch back to the original equirectangular image to build the digital tour.
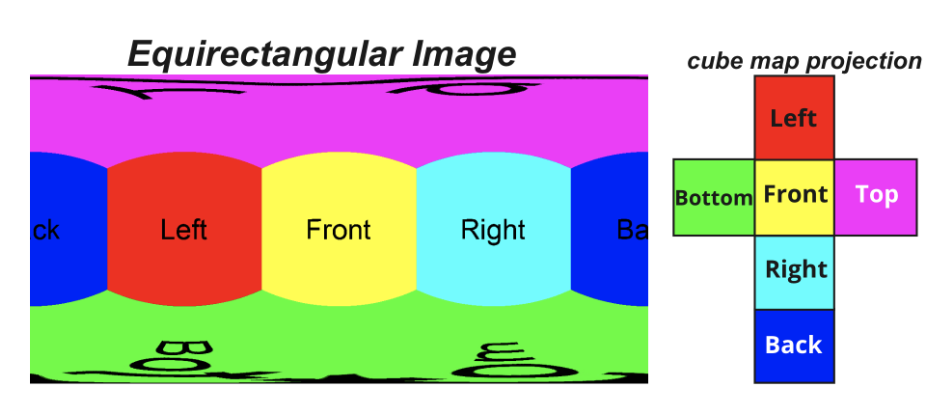
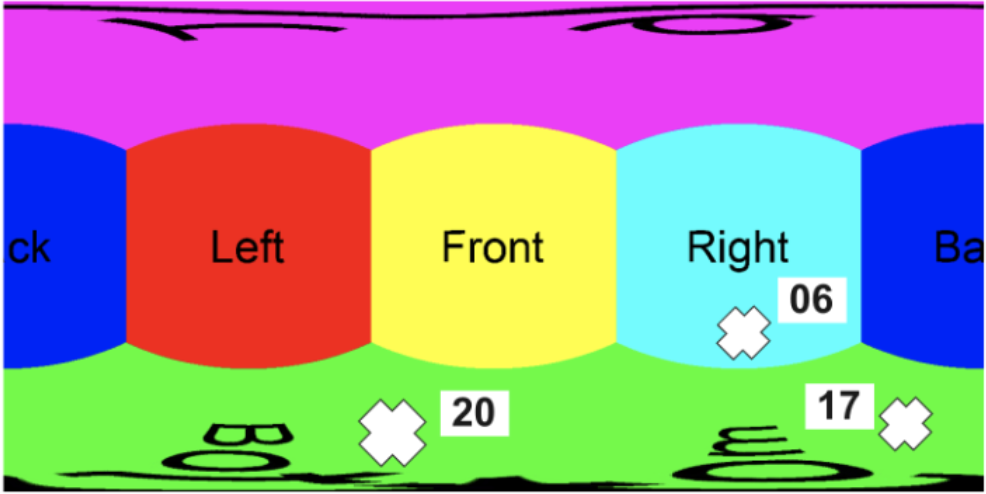
In this work, we propose to use cube map projection, which is a set of six images representing six faces of a cube. Here, every point in the spherical coordinate space corresponds to a point in the face of the cube. As shown in Figure 5, we map the equirectangular image to six faces (left, right, front, back, top and bottom) of a cube having dimensions 1024 × 1024 × 3 using python library vrProjector.
2.3 Tag Detection
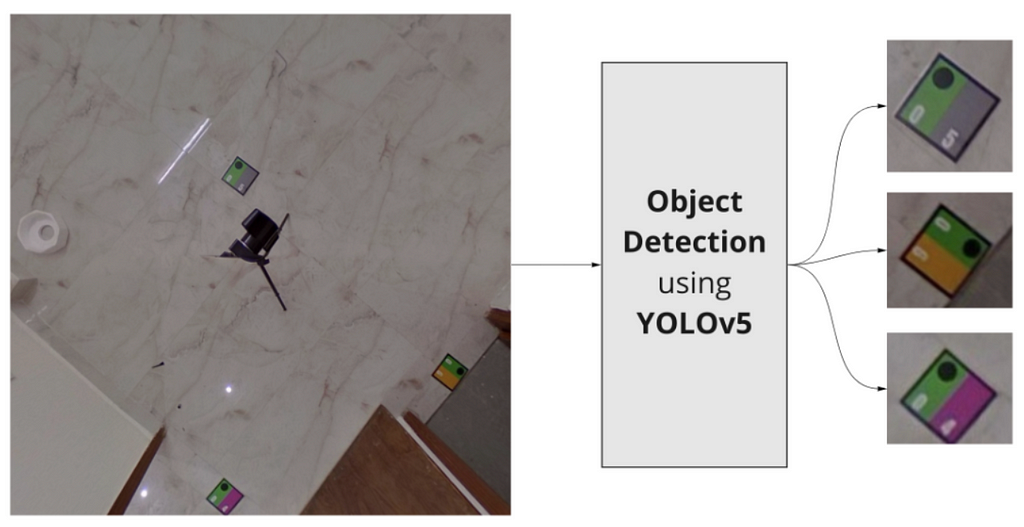
Once we get the six images corresponding to the faces of a cube, we detect the location of tags placed in each image. For tag detection, we have used the state-of-the-art YOLOv5 model. We initialized the network with COCO weights followed by training on our dataset. As shown in Figure 6, the model takes an image as input and returns the detected tag along with coordinates of the bounding box and confidence of the prediction. The model is trained on our dataset for 100 epochs with a batch size of 32.
2.4 Digit Recognition
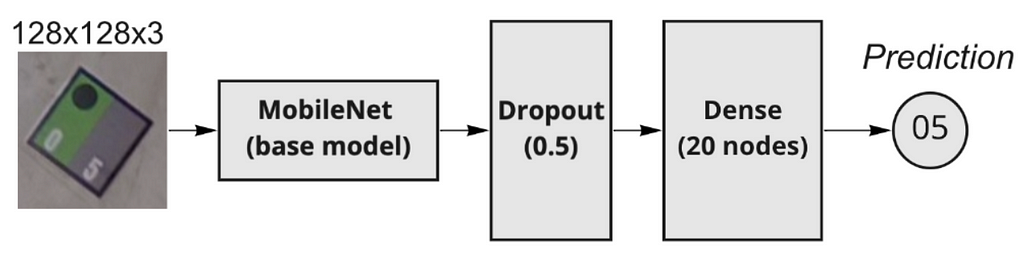
For the detected tags, we need to recognize the digits from the tag. In a real-world environment, the detected tags might have incorrect orientation, poor luminosity, reflection from the bulbs in the room, etc. Due to these reasons, it is challenging to use Optical Character Recognition (OCR) engines to have good digit recognition performance. Therefore, we have used a custom MobileNet model initialized on Imagenet weights, which uses color information in tags for digit recognition. In the proposed architecture, we have replaced the final classification block of the original MobileNet with the dropout layer and dense layer with 20 nodes representing our tags from 1 to 20. Figure 7 illustrates the proposed architecture. For training the model, we have used Adam as an optimizer with a learning rate of 0.001 and a discounting factor (𝜌) to be 0.1. We have used categorical cross-entropy as a loss function and set the batch size to 64 and the number of epochs to 50.
2.5 Mapping tag coordinates to the original 360◦ Image and Virutal Tour Creation
Once we have detected the tags and recognized the digits we use the python library vrProjector to map the cube map coordinates back to the original equirectangular image. An example output is shown in Figure 8. For each equirectangular image, the detected tags form the nodes of a graph with an edge between them. In the subsequent equirectangular images of a property, the graph gets populated with more nodes, as more tags are detected. Finally, we connect multiple equirectangular images in sequence based on recognized digits written on them and the resulting graph is the
virtual tour as shown in Figure 2(b).
4. Datasets
We have collected data by placing tags and clicking equirectangular images using Ricoh-Theta camera for several residential properties in Gurugram, India (Tier 1 city). While collecting images we made sure that certain conditions were met such as all doors were opened, lights were turned on, ‘unwanted’ objects were removed and the tags were placed covering each area of the property. Following these instructions, average number of equirectangular images clicked per residential property was 7 or 8. Finally, we have validated our approach on the following generated datasets (based on background color of the tags).
- Green Colored Tags: We have kept the background color of these tags (numbered 1 to 20) to be green. We have collected 1572 equirectangular images from 212 properties. Once we convert these equirectangular images to cubemap projection, we get 9432 images (corresponding to cube faces). Since not all of the cube faces have tags (for e.g. top face), we get 1503 images with atleast one tag.
- Proposed Bi-colored Tags (see Figure 4): For these tags, we have collected 2654 equirectangular images from 350 properties. Finally, we got 2896 images (corresponding to cube faces) with atleast one tag.
Finally, we label the tags present in cube map projection images using LabelImg which is an open-source tool for labeling images in several formats such as Pascal VOC and YOLO. For all the experiments, we reserved 20% of data for testing and the remaining for training.
5. End-to-end Evaluation
For any input image, we first detect the tags and finally recognize the digits written on the tags. From this we were able to identify the true positives (tags detected and read correctly), false positives (tags detected but read incorrectly) and false negatives (tags not detected). The obtained mAP, Precision, Recall and f1-score at 0.5 IoU threshold are 88.12, 93.83, 97.89 and 95.81 respectively. Please note that all metrics are averaged (weighted) over all the 20 classes. If all tags across all equirectangular images of a property are detected and read correctly, we receive a 100% accurate virtual tour since all nodes of the graph are detected and connected with their appropriate edges. In our experiments, we were able to accurately generate 100% accurate virtual tour for 94.55% of the properties. The inaccuracies were due to the presence of colorful artifacts that were falsely detected as tags; and bad lightning conditions.
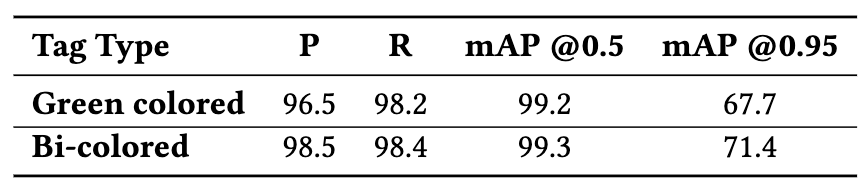
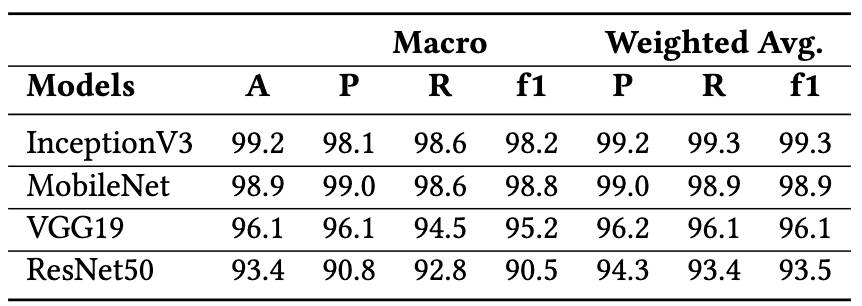
Figure 9 demonstrates the performance of Yolov5 model for tag detection based on green colored and bi-colored tags. Further, experiments and comparison of models on digit recognition is shown in Figure 10.
5. Conclusion
We propose an end-to-end pipeline (DIGITOUR) for automatically generating digital tours for real-estate properties. For any such property, we first place the proposed bi-colored paper tags covering each area of the property. Then, we click equirectangular images, followed by mapping these images to less distorted cubemap images. Once we get the six images corresponding to cube faces, we detect the location of tags using the YOLOv5 model, followed by digit recognition using the MobileNet model. The next step is to map the detected coordinates along with recognized digits to the original equirectangular images. Finally, we stitch together all the equirectangular images to build a virtual tour. We have validated our pipeline on a real-world dataset and shown that the end-to-end pipeline performance is 88.12 and 95.81 in terms of mAP and f1-score at 0.5 IoU threshold averaged (weighted) over all classes.
If you find our work beneficial and utilize it in your projects, we kindly request that you cite it. 😊
@inproceedings{chhikara2023digitour,
  title={Digitour: Automatic digital tours for real-estate properties},
  author={Chhikara, Prateek and Kuhar, Harshul and Goyal, Anil and Sharma, Chirag},
  booktitle={Proceedings of the 6th Joint International Conference on Data Science \& Management of Data (10th ACM IKDD CODS and 28th COMAD)},
  pages={223--227},
  year={2023}
}
References
[1] Dragomir Anguelov, Carole Dulong, Daniel Filip, Christian Frueh, Stéphane Lafon, Richard Lyon, Abhijit Ogale, Luc Vincent, and Josh Weaver. 2010. Google street view: Capturing the world at street level. Computer 43, 6 (2010), 32–38.
[2] Mohamad Zaidi Sulaiman, Mohd Nasiruddin Abdul Aziz, Mohd Haidar Abu Bakar, Nur Akma Halili, and Muhammad Asri Azuddin. 2020. Matterport: virtual tour as a new marketing approach in real estate business during pandemic COVID-19. In International Conference of Innovation in Media and Visual Design (IMDES 2020). Atlantis Press, 221–226.
[3] Chinu Subudhi. 2021. Cutting-Edge 360-Degree Virtual Tours. https://www.mindtree.com/insights/resources/cutting-edge-360-degree-virtual-tours
[4] Glenn Jocher, Ayush Chaurasia, Alex Stoken, Jirka Borovec, NanoCode012, Yonghye Kwon, TaoXie, Jiacong Fang, imyhxy, Kalen Michael, Lorna, Abhiram V, Diego Montes, Jebastin Nadar, Laughing, tkianai, yxNONG, Piotr Skalski, Zhiqiang Wang, Adam Hogan, Cristi Fati, Lorenzo Mammana, AlexWang1900, Deep Patel, Ding Yiwei, Felix You, Jan Hajek, Laurentiu Diaconu, and Mai Thanh Minh. 2022. ultralytics/yolov5: v6.1 — TensorRT, TensorFlow Edge TPU and OpenVINO Export and Inference.
[5] Mark Sandler, Andrew Howard, Menglong Zhu, Andrey Zhmoginov, and LiangChieh Chen. 2018. Mobilenetv2: Inverted residuals and linear bottlenecks. In Proceedings of the IEEE conference on computer vision and pattern recognition. 4510–4520.
DIGITOUR: Automatic Digital Tours for Real-Estate Properties 🏠 was originally published in Towards Data Science on Medium, where people are continuing the conversation by highlighting and responding to this story.
An Automated Pipeline for Creating 3D Experiences from Equirectangular Images
1. Introduction
The demand for online real-estate tools has increased drastically due to the ease of accessibility to the Internet, especially in countries like India. There are many online real-estate platforms for owners, developers, and real-estate brokers to post properties for buying and renting purposes. Daily, these platforms receive 8,000 to 9,000 new listings. Until now, the users on these platforms view images, snapshots, or videos, which may not build the desired confidence to decide and finalize the deal. To overcome this challenge and to enhance user experience, virtual tours are a potential solution.
Virtual tours are images linked together, allowing viewers to experience a particular location remotely (a frequently used example is Google Street View [1]). Recently, the demand for virtual tours has increased as they provide better interaction with users/customers, especially in businesses like real-estate, hotels, restaurants, universities, schools, etc [2]. Broadly, there are three categories of virtual tours:
- 2D video tours,
- 360◦ video-based virtual tours, and
- 360◦ static image-based virtual tours.
Compared to 2D video tours and 360◦ video-based tours, the static equirectangular image-based virtual tours provide more immersion and interactivity, thus leading to better decision-making and avoiding unnecessary visits.
🚀 Before delving deep into the proposed work, I would like to mention that this work is published and available at the International Conference on Data Science & Management of Data (CODS-COMAD)— 2023. ✨✨✨
Typically, the pipeline for creating a virtual tour consists of the following components:
- Equirectangular Image Capture: An equirectangular image represents a spherical object as a 2D image (as shown in Figure 1). It is a spherical panorama incorporating 180° vertical and 360° horizontal viewing angles. A simple example can be the projection of Earth (a spherical-shaped object) on a 2D map. These images are clicked using 360◦ cameras such as Ricoh-Theta, Insta3602, etc.
- Connecting Equirectangular Images: For any location, we will have multiple equirectangular images. To illustrate, in real estate properties, we typically have equilateral images for bedrooms, halls, kitchens, dining rooms, etc. It is essential to build navigation between images to have a complete “walkthrough” experience. Moreover, there can be multiple routes from one position to other positions. For instance, we can go from the hall to the kitchen, bedroom, balcony, etc. Therefore, it is crucial to connect all the equirectangular images (please refer to Figure 2 for an example). Generally, it is done manually, which is both costly and time-consuming [3].
- Publishing Virtual Tour: Once we have formed connections between equirectangular images, we can publish the final virtual tour on the cloud or in an application.
While automating the above pipeline, one of the significant challenges is the manual annotation for connecting equirectangular images. Generally, it takes more than 20 minutes to create a virtual tour. We propose an end-to-end pipeline for real-estate equirectangular images (called DIGITOUR) to overcome the challenge of creating automated digital tours. The DIGITOUR pipeline consists of the following components:
- Colored tag placement and clicking 360° images: We propose novel paper tags that are bi-colored and numbered, facilitating better learning of downstream computer vision tasks (i.e., tag recognition and digit recognition) and automatic stitching of equirectangular images.
- Map equirectangular images to cube map projection: We used the publicly available Python library vrProjector3 to map equirectangular images to their cube map projections (corresponding to six cube faces).
- Tag Detection: For each cube face, we propose colored tag detection in an image using YOLOv5 [4] architecture.
- Digit Recognition: We propose to perform digit recognition using a light-weight custom MobileNet [5] model.
Finally, we connect all the equirectangular images using the detected tags.
2. Proposed Pipeline: DIGITOUR
The complete pipeline for producing digital tours (referred to as DIGITOUR and shown in Figure 3) is as follows.
2.1 Tag Placement and Image Capturing
While creating a digital tour for any real-estate property, it is essential to click 360◦ images from different property locations such as bedroom, living room, kitchen, etc., then automatically stitching them together to have a “walkthrough” experience without being physically present at the location. Therefore, to connect multiple equirectangular images, we propose placing paper tags on the floor covering each location of the property, and placing the camera (in our case, we used Ricoh-Theta) in the middle of the scene to capture the whole site (front, back, left, right and bottom).
Moreover, we ensure that the scene is clear of all noisy elements such as dim lighting and ‘unwanted’ artifacts for better model training and inference. As shown in Figure 4, we have standardized the tags with dimensions of 6” × 6” with two properties:
- they are numbered which will help the photographer place tags in sequence and
- they are bi-colored to formulate the digit recognition problem as classification task and facilitate better learning of downstream computer vision tasks (i.e. tag detection and digit recognition).
Please note that different colors are assigned to each digit (from 0 to 9) using the HSV color scheme and leading digit of a tag has a black circle to distinguish it from the trailing digit as shown in Figure 4. The intuition behind standardizing the paper tags is that it allows to train tag detection and digit recognition models, which are invariant to distortions, tag placement angle, reflection from lighting sources, blur conditions, and camera quality.
2.2 Mapping Equirectangular Image to Cubemap Projection
An equirectangular image consists of a single image whose width and height correlate as 2 : 1 (as shown in Figure 1). In our case, images are clicked using a Ricoh-Theta camera having dimensions 4096 × 2048 × 3. Typically, each point in an equirectangular image corresponds to a point in a sphere, and the images are stretched in the ‘latitude’ direction. Since the contents of an equirectangular image are distorted, it becomes challenging to detect tags and recognize digits directly from it. For example, in Figure 1, the tag is stretched at the middle-bottom of the image. Therefore, it is necessary to map the image to a less-distorted projection and switch back to the original equirectangular image to build the digital tour.
In this work, we propose to use cube map projection, which is a set of six images representing six faces of a cube. Here, every point in the spherical coordinate space corresponds to a point in the face of the cube. As shown in Figure 5, we map the equirectangular image to six faces (left, right, front, back, top and bottom) of a cube having dimensions 1024 × 1024 × 3 using python library vrProjector.
2.3 Tag Detection
Once we get the six images corresponding to the faces of a cube, we detect the location of tags placed in each image. For tag detection, we have used the state-of-the-art YOLOv5 model. We initialized the network with COCO weights followed by training on our dataset. As shown in Figure 6, the model takes an image as input and returns the detected tag along with coordinates of the bounding box and confidence of the prediction. The model is trained on our dataset for 100 epochs with a batch size of 32.
2.4 Digit Recognition
For the detected tags, we need to recognize the digits from the tag. In a real-world environment, the detected tags might have incorrect orientation, poor luminosity, reflection from the bulbs in the room, etc. Due to these reasons, it is challenging to use Optical Character Recognition (OCR) engines to have good digit recognition performance. Therefore, we have used a custom MobileNet model initialized on Imagenet weights, which uses color information in tags for digit recognition. In the proposed architecture, we have replaced the final classification block of the original MobileNet with the dropout layer and dense layer with 20 nodes representing our tags from 1 to 20. Figure 7 illustrates the proposed architecture. For training the model, we have used Adam as an optimizer with a learning rate of 0.001 and a discounting factor (𝜌) to be 0.1. We have used categorical cross-entropy as a loss function and set the batch size to 64 and the number of epochs to 50.
2.5 Mapping tag coordinates to the original 360◦ Image and Virutal Tour Creation
Once we have detected the tags and recognized the digits we use the python library vrProjector to map the cube map coordinates back to the original equirectangular image. An example output is shown in Figure 8. For each equirectangular image, the detected tags form the nodes of a graph with an edge between them. In the subsequent equirectangular images of a property, the graph gets populated with more nodes, as more tags are detected. Finally, we connect multiple equirectangular images in sequence based on recognized digits written on them and the resulting graph is the
virtual tour as shown in Figure 2(b).
4. Datasets
We have collected data by placing tags and clicking equirectangular images using Ricoh-Theta camera for several residential properties in Gurugram, India (Tier 1 city). While collecting images we made sure that certain conditions were met such as all doors were opened, lights were turned on, ‘unwanted’ objects were removed and the tags were placed covering each area of the property. Following these instructions, average number of equirectangular images clicked per residential property was 7 or 8. Finally, we have validated our approach on the following generated datasets (based on background color of the tags).
- Green Colored Tags: We have kept the background color of these tags (numbered 1 to 20) to be green. We have collected 1572 equirectangular images from 212 properties. Once we convert these equirectangular images to cubemap projection, we get 9432 images (corresponding to cube faces). Since not all of the cube faces have tags (for e.g. top face), we get 1503 images with atleast one tag.
- Proposed Bi-colored Tags (see Figure 4): For these tags, we have collected 2654 equirectangular images from 350 properties. Finally, we got 2896 images (corresponding to cube faces) with atleast one tag.
Finally, we label the tags present in cube map projection images using LabelImg which is an open-source tool for labeling images in several formats such as Pascal VOC and YOLO. For all the experiments, we reserved 20% of data for testing and the remaining for training.
5. End-to-end Evaluation
For any input image, we first detect the tags and finally recognize the digits written on the tags. From this we were able to identify the true positives (tags detected and read correctly), false positives (tags detected but read incorrectly) and false negatives (tags not detected). The obtained mAP, Precision, Recall and f1-score at 0.5 IoU threshold are 88.12, 93.83, 97.89 and 95.81 respectively. Please note that all metrics are averaged (weighted) over all the 20 classes. If all tags across all equirectangular images of a property are detected and read correctly, we receive a 100% accurate virtual tour since all nodes of the graph are detected and connected with their appropriate edges. In our experiments, we were able to accurately generate 100% accurate virtual tour for 94.55% of the properties. The inaccuracies were due to the presence of colorful artifacts that were falsely detected as tags; and bad lightning conditions.
Figure 9 demonstrates the performance of Yolov5 model for tag detection based on green colored and bi-colored tags. Further, experiments and comparison of models on digit recognition is shown in Figure 10.
5. Conclusion
We propose an end-to-end pipeline (DIGITOUR) for automatically generating digital tours for real-estate properties. For any such property, we first place the proposed bi-colored paper tags covering each area of the property. Then, we click equirectangular images, followed by mapping these images to less distorted cubemap images. Once we get the six images corresponding to cube faces, we detect the location of tags using the YOLOv5 model, followed by digit recognition using the MobileNet model. The next step is to map the detected coordinates along with recognized digits to the original equirectangular images. Finally, we stitch together all the equirectangular images to build a virtual tour. We have validated our pipeline on a real-world dataset and shown that the end-to-end pipeline performance is 88.12 and 95.81 in terms of mAP and f1-score at 0.5 IoU threshold averaged (weighted) over all classes.
If you find our work beneficial and utilize it in your projects, we kindly request that you cite it. 😊
@inproceedings{chhikara2023digitour,
  title={Digitour: Automatic digital tours for real-estate properties},
  author={Chhikara, Prateek and Kuhar, Harshul and Goyal, Anil and Sharma, Chirag},
  booktitle={Proceedings of the 6th Joint International Conference on Data Science \& Management of Data (10th ACM IKDD CODS and 28th COMAD)},
  pages={223--227},
  year={2023}
}
References
[1] Dragomir Anguelov, Carole Dulong, Daniel Filip, Christian Frueh, Stéphane Lafon, Richard Lyon, Abhijit Ogale, Luc Vincent, and Josh Weaver. 2010. Google street view: Capturing the world at street level. Computer 43, 6 (2010), 32–38.
[2] Mohamad Zaidi Sulaiman, Mohd Nasiruddin Abdul Aziz, Mohd Haidar Abu Bakar, Nur Akma Halili, and Muhammad Asri Azuddin. 2020. Matterport: virtual tour as a new marketing approach in real estate business during pandemic COVID-19. In International Conference of Innovation in Media and Visual Design (IMDES 2020). Atlantis Press, 221–226.
[3] Chinu Subudhi. 2021. Cutting-Edge 360-Degree Virtual Tours. https://www.mindtree.com/insights/resources/cutting-edge-360-degree-virtual-tours
[4] Glenn Jocher, Ayush Chaurasia, Alex Stoken, Jirka Borovec, NanoCode012, Yonghye Kwon, TaoXie, Jiacong Fang, imyhxy, Kalen Michael, Lorna, Abhiram V, Diego Montes, Jebastin Nadar, Laughing, tkianai, yxNONG, Piotr Skalski, Zhiqiang Wang, Adam Hogan, Cristi Fati, Lorenzo Mammana, AlexWang1900, Deep Patel, Ding Yiwei, Felix You, Jan Hajek, Laurentiu Diaconu, and Mai Thanh Minh. 2022. ultralytics/yolov5: v6.1 — TensorRT, TensorFlow Edge TPU and OpenVINO Export and Inference.
[5] Mark Sandler, Andrew Howard, Menglong Zhu, Andrey Zhmoginov, and LiangChieh Chen. 2018. Mobilenetv2: Inverted residuals and linear bottlenecks. In Proceedings of the IEEE conference on computer vision and pattern recognition. 4510–4520.
DIGITOUR: Automatic Digital Tours for Real-Estate Properties 🏠 was originally published in Towards Data Science on Medium, where people are continuing the conversation by highlighting and responding to this story.
Denial of responsibility! Techno Blender is an automatic aggregator of the all world’s media. In each content, the hyperlink to the primary source is specified. All trademarks belong to their rightful owners, all materials to their authors. If you are the owner of the content and do not want us to publish your materials, please contact us by email – [email protected]. The content will be deleted within 24 hours.