
How to Create a PDF Report for Your Data Analysis in Python | by Leonie Monigatti | Oct, 2022
Automate PDF generation with the FPDF library as part of your data analysis
Once you are done with your data analysis, you need to think about how to communicate the results. One part of that communication is to decide in which file format you will provide your data analysis report. I’m sure most stakeholders would prefer a PDF file over an iPython Notebook.
This article will discuss how you can automate PDF generation as part of your data analysis workflow including:
For this tutorial, we will use the fpdf library [1].
from fpdf import FPDF
Although the library isn’t actively maintained and hasn’t been updated since 2012 [1], it is straightforward to use for most use cases. If you have more complex needs for your PDF generation, you can check out alternatives like PyPDF2, ReportLab, or WeasyPrint.
PDF generation with the fpdf library [1] in Python is straightforward. To create an empty PDF document, you create an instance of the class FPDF, add a blank page, and save it with the following three lines of code.
pdf = FPDF()
pdf.add_page()
pdf.output(f'./example.pdf', 'F')

The default page is an A4 format in portrait mode with 1cm margins. You can define custom page configurations with the parameters of the add_page() method.
Layout and Placing Text
Next, let’s understand the layout of the document.
You can add text cells with the cell() method. To showcase the resulting layout, we will set the parameter border = 1, which shows the cell’s border. When you achieve your desired design, you can set the parameter value back to 0.
With the w and h parameters, you can define the width and height of the text cell. A w = 0 will result in a text cell that spans across the entire page width.
The ln parameter defines where the position should go after this cell:
- 0: to the right of the current cell
- 1: to the beginning of the next line
- 2: below the current cell
To create space between cells, you can use the set_xy() method to specify a specific position for the next element or the ln() method to create vertical space.
Below you can see a few examples of cells and their layouts. You can find the respective code by the cell name.
# Margin
m = 10
# Page width: Width of A4 is 210mm
pw = 210 - 2*MARGIN
# Cell height
ch = 50pdf = FPDF()
pdf.add_page()
pdf.set_font('Arial', '', 12)pdf.cell(w=0, h=ch, txt="Cell 1", border=1, ln=1)pdf.cell(w=(pw/2), h=ch, txt="Cell 2a", border=1, ln=0)
pdf.cell(w=(pw/2), h=ch, txt="Cell 2b", border=1, ln=1)pdf.cell(w=(pw/3), h=ch, txt="Cell 3a", border=1, ln=0)
pdf.cell(w=(pw/3), h=ch, txt="Cell 3b", border=1, ln=0)
pdf.cell(w=(pw/3), h=ch, txt="Cell 3c", border=1, ln=1)pdf.cell(w=(pw/3), h=ch, txt="Cell 4a", border=1, ln=0)
pdf.cell(w=(pw/3)*2, h=ch, txt="Cell 4b", border=1, ln=1)pdf.set_xy(x=10, y= 220) # or use pdf.ln(50)
pdf.cell(w=0, h=ch, txt="Cell 5", border=1, ln=1)pdf.output(f'./example.pdf', 'F')

Header and Footer
You can also specify a header and footer shown on each page in the PDF document. For this, you need to overwrite the header() and footer() methods in a custom class. Don’t forget to use an instance of your custom class instead of the FPDF class.
# Custom class to overwrite the header and footer methods
class PDF(FPDF):
def __init__(self):
super().__init__()
def header(self):
self.set_font('Arial', '', 12)
self.cell(0, 10, 'Header', 1, 1, 'C')
def footer(self):
self.set_y(-15)
self.set_font('Arial', '', 12)
self.cell(0, 10, 'Footer', 1, 0, 'C')pdf = PDF() # Instance of custom class
pdf.add_page()
pdf.set_font('Arial', '', 12)
pdf.cell(w=0, h=255, txt = "Body", border = 1, ln = 1, align = 'C')pdf.output(f'./example.pdf', 'F')

Now that you have understood how to lay out a PDF document, let’s fill the cells with some content.
Styling Text
The fpdf library offers you the basics to style your text:
- With the
set_font()method, you can set the font, the font size, and the emphasis (regular, bold, italic). - In the
cellmethod, you can define the text alignment with thealignparameter. - To fill the background of a cell, you need to define a color with the
set_fill_color()method and also definefill = Truein thecell()method. - To change the color of a cell’s text, you can define a color with the
set_text_color()method.
pdf = FPDF()
pdf.add_page()pdf.set_font('Arial', '', 16)
pdf.cell(w=0, h=10, txt="This is regular text.", ln=1)pdf.set_font('Arial', 'B', 16)
pdf.cell(w=0, h=10, txt="This is bold text.", ln=1)pdf.set_font('Arial', 'I', 16)
pdf.cell(w=0, h=10, txt="This is italic text.", ln=1)pdf.set_font('Arial', '', 16) # Reset text back to regularpdf.cell(w=0, h=10, txt="This is left aligned text.", ln=1,
align='L')
pdf.cell(w=0, h=10, txt="This is center aligned text.", ln=1,
align='C')
pdf.cell(w=0, h=10, txt="This is right aligned text.", ln=1,
align='R')pdf.set_fill_color(r= 0, g= 128, b = 0)
pdf.cell(w=0, h=10, txt="This is text with filled background.", ln=1,
fill=True)pdf.set_text_color(r= 0, g= 128, b = 0)
pdf.cell(w=0, h=10, txt="This is colored text.", ln=1)pdf.output(f'./example.pdf', 'F')

Line and Page Breaks
If you need a block of longer text, the cell() method is insufficient because it doesn’t allow for line or page breaks, as you can see below.
For this purpose, you should use the multi_cell() method instead, which can handle line and page breaks.
import lorem # Use this package to showcase long textspdf = FPDF()
pdf.add_page()
pdf.set_font('Arial', '', 16)pdf.cell(w=0, h=50, txt="This and the below cells are regular cells." , border=1, ln=1)pdf.cell(w=0, h=50, txt="Example: " + lorem.text(), border=1, ln=1)pdf.multi_cell(w=0, h=50, txt="This and the below cells are multi cells.", border=1, )pdf.multi_cell(w=0, h=5, txt="Example: " + lorem.text(), border=1, )pdf.output(f'./example.pdf', 'F')

Template
With everything you have learned so far, you can now create a simple template like the one shown below. We will use this for the following examples.
# cell height
ch = 8class PDF(FPDF):
def __init__(self):
super().__init__()
def header(self):
self.set_font('Arial', '', 12)
self.cell(0, 8, 'Header', 0, 1, 'C')
def footer(self):
self.set_y(-15)
self.set_font('Arial', '', 12)
self.cell(0, 8, f'Page {self.page_no()}', 0, 0, 'C')pdf = PDF()
pdf.add_page()
pdf.set_font('Arial', 'B', 24)
pdf.cell(w=0, h=20, txt="Title", ln=1)pdf.set_font('Arial', '', 16)
pdf.cell(w=30, h=ch, txt="Date: ", ln=0)
pdf.cell(w=30, h=ch, txt="01/01/2022", ln=1)
pdf.cell(w=30, h=ch, txt="Author: ", ln=0)
pdf.cell(w=30, h=ch, txt="Max Mustermann", ln=1)pdf.ln(ch)
pdf.multi_cell(w=0, h=5, txt=lorem.paragraph())pdf.ln(ch)
pdf.multi_cell(w=0, h=5, txt=lorem.paragraph())pdf.output(f'./example.pdf', 'F')

For the following examples, we will be using a small fictional dataset.
import pandas as pddf = pd.DataFrame(
{'feature 1' : ['cat 1', 'cat 2', 'cat 3', 'cat 4'],
'feature 2' : [400, 300, 200, 100]
})

Aside from text, you might need to add plots to your PDF report.
To add plots to your PDF report, you first need to save your Matplotlib plots as images (e.g., PNG files).
import matplotlib.pyplot as plt
import seaborn as snsfig, ax = plt.subplots(1,1, figsize = (6, 4))sns.barplot(data =  df, x = 'feature 1', y = 'feature 2')
plt.title("Chart")plt.savefig('./example_chart.png',
transparent=False,
facecolor='white',
bbox_inches="tight")

Once your Matplotlib plot is saved as an image, you can add it to the report with the image() method.
pdf = PDF()
pdf.add_page()
pdf.set_font('Arial', 'B', 24)
pdf.cell(w=0, h=20, txt="Title", ln=1)pdf.set_font('Arial', '', 16)
pdf.cell(w=30, h=ch, txt="Date: ", ln=0)
pdf.cell(w=30, h=ch, txt="01/01/2022", ln=1)
pdf.cell(w=30, h=ch, txt="Author: ", ln=0)
pdf.cell(w=30, h=ch, txt="Max Mustermann", ln=1)pdf.ln(ch)
pdf.multi_cell(w=0, h=5, txt=lorem.paragraph())pdf.image('./example_chart.png',
x = 10, y = None, w = 100, h = 0, type = 'PNG')pdf.ln(ch)
pdf.multi_cell(w=0, h=5, txt=lorem.paragraph())pdf.output(f'./example.pdf', 'F')

Unfortunately, there is no simple way to add a pandas DataFrame to a PDF report with the FPDF library. Although adding a pandas DataFrame as a table to a PDF report requires some light coding, it is not difficult either: By using the cell() method with border=1 and effectively utilizing the ln parameter, you can iterate over the DataFrame to create a table.
pdf = PDF()
pdf.add_page()
pdf.set_font('Arial', 'B', 24)
pdf.cell(w=0, h=20, txt="Title", ln=1)pdf.set_font('Arial', '', 16)
pdf.cell(w=30, h=ch, txt="Date: ", ln=0)
pdf.cell(w=30, h=ch, txt="01/01/2022", ln=1)
pdf.cell(w=30, h=ch, txt="Author: ", ln=0)
pdf.cell(w=30, h=ch, txt="Max Mustermann", ln=1)pdf.ln(ch)
pdf.multi_cell(w=0, h=5, txt=lorem.paragraph())pdf.image('./example_chart.png', x = 10, y = None, w = 100, h = 0, type = 'PNG', link = '')pdf.ln(ch)
pdf.multi_cell(w=0, h=5, txt=lorem.paragraph())pdf.ln(ch)# Table Header
pdf.set_font('Arial', 'B', 16)
pdf.cell(w=40, h=ch, txt='Feature 1', border=1, ln=0, align='C')
pdf.cell(w=40, h=ch, txt='Feature 2', border=1, ln=1, align='C')# Table contents
pdf.set_font('Arial', '', 16)
for i in range(0, len(df)):
pdf.cell(w=40, h=ch,
txt=df['feature 1'].iloc[i],
border=1, ln=0, align='C')
pdf.cell(w=40, h=ch,
txt=df['feature 2'].iloc[i].astype(str),
border=1, ln=1, align='C')pdf.output(f'./example.pdf', 'F')
Technically, you could also convert your pandas DataFrame to a Matplotlib table, save it as an image and insert the table as an image to the PDF. But I tried this out, so you don’t have to: It’s not very pretty.
Although critics say there are better alternatives to the fpdf library, it is simple to use.
This article showed you:
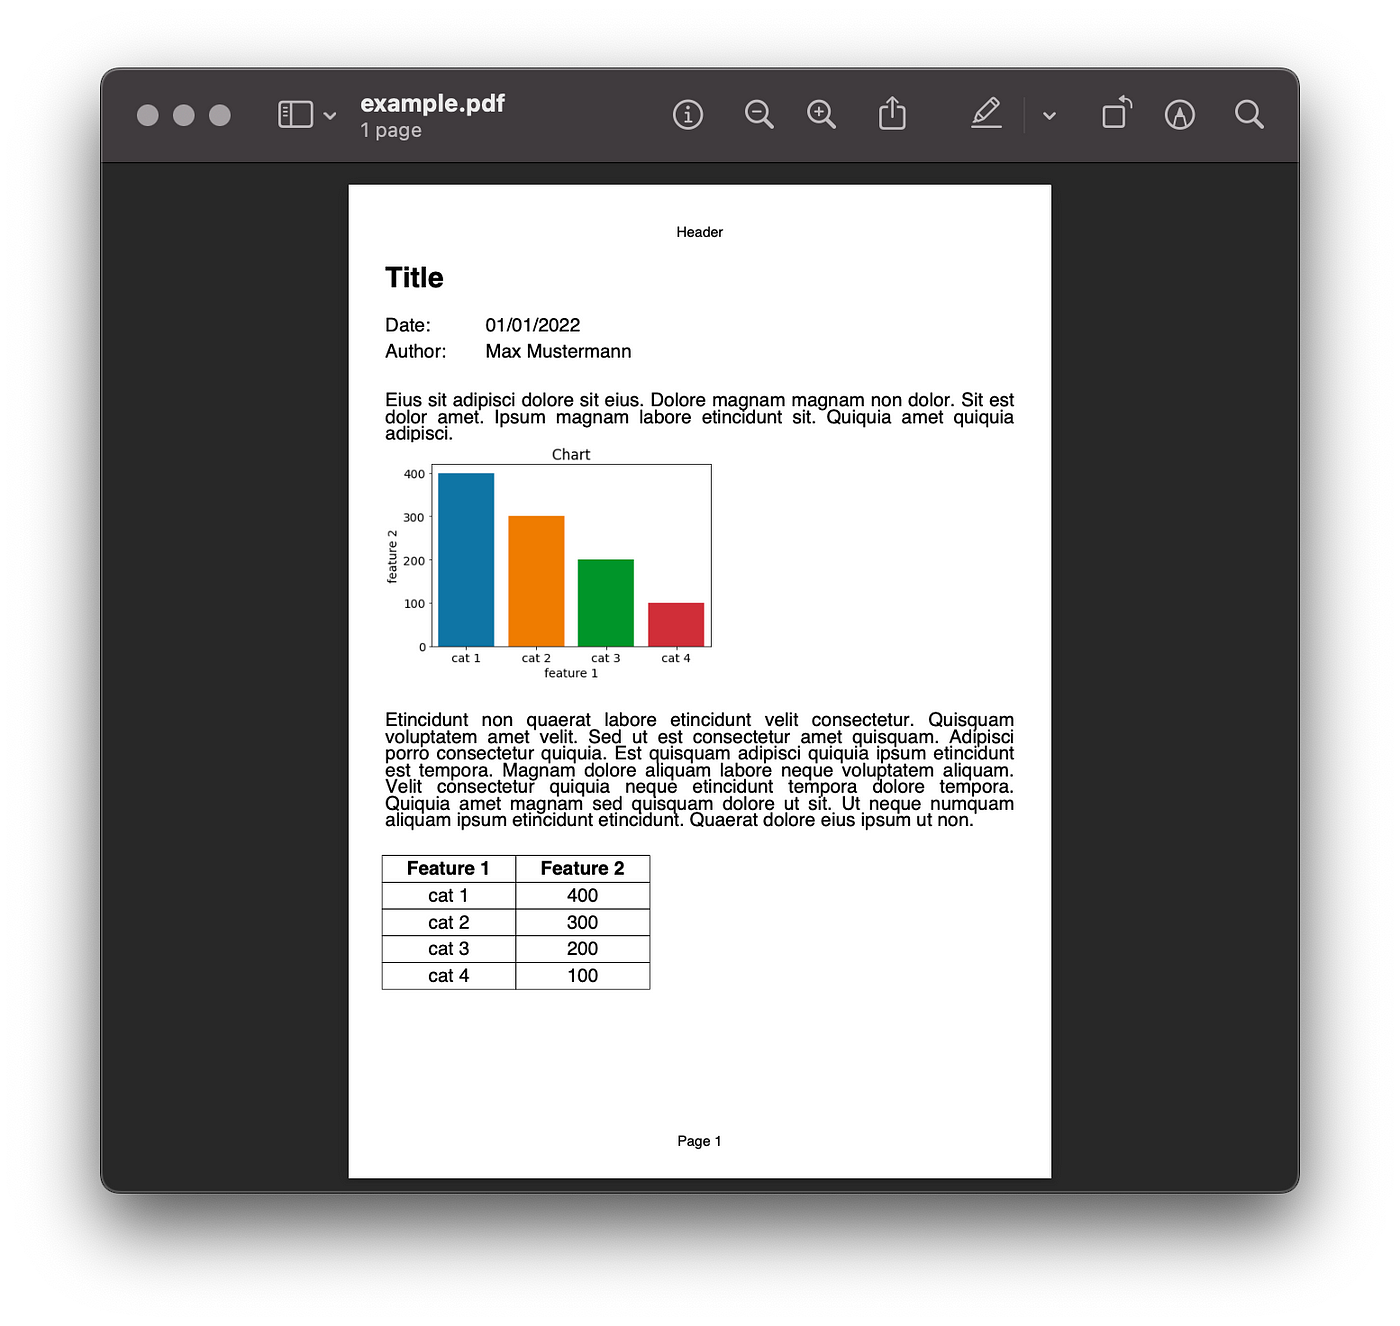
Below you can copy the template code that generates the following PDF and adjust it for your purposes.
Automate PDF generation with the FPDF library as part of your data analysis
Once you are done with your data analysis, you need to think about how to communicate the results. One part of that communication is to decide in which file format you will provide your data analysis report. I’m sure most stakeholders would prefer a PDF file over an iPython Notebook.
This article will discuss how you can automate PDF generation as part of your data analysis workflow including:
For this tutorial, we will use the fpdf library [1].
from fpdf import FPDF
Although the library isn’t actively maintained and hasn’t been updated since 2012 [1], it is straightforward to use for most use cases. If you have more complex needs for your PDF generation, you can check out alternatives like PyPDF2, ReportLab, or WeasyPrint.
PDF generation with the fpdf library [1] in Python is straightforward. To create an empty PDF document, you create an instance of the class FPDF, add a blank page, and save it with the following three lines of code.
pdf = FPDF()
pdf.add_page()
pdf.output(f'./example.pdf', 'F')
The default page is an A4 format in portrait mode with 1cm margins. You can define custom page configurations with the parameters of the add_page() method.
Layout and Placing Text
Next, let’s understand the layout of the document.
You can add text cells with the cell() method. To showcase the resulting layout, we will set the parameter border = 1, which shows the cell’s border. When you achieve your desired design, you can set the parameter value back to 0.
With the w and h parameters, you can define the width and height of the text cell. A w = 0 will result in a text cell that spans across the entire page width.
The ln parameter defines where the position should go after this cell:
- 0: to the right of the current cell
- 1: to the beginning of the next line
- 2: below the current cell
To create space between cells, you can use the set_xy() method to specify a specific position for the next element or the ln() method to create vertical space.
Below you can see a few examples of cells and their layouts. You can find the respective code by the cell name.
# Margin
m = 10
# Page width: Width of A4 is 210mm
pw = 210 - 2*MARGIN
# Cell height
ch = 50pdf = FPDF()
pdf.add_page()
pdf.set_font('Arial', '', 12)pdf.cell(w=0, h=ch, txt="Cell 1", border=1, ln=1)pdf.cell(w=(pw/2), h=ch, txt="Cell 2a", border=1, ln=0)
pdf.cell(w=(pw/2), h=ch, txt="Cell 2b", border=1, ln=1)pdf.cell(w=(pw/3), h=ch, txt="Cell 3a", border=1, ln=0)
pdf.cell(w=(pw/3), h=ch, txt="Cell 3b", border=1, ln=0)
pdf.cell(w=(pw/3), h=ch, txt="Cell 3c", border=1, ln=1)pdf.cell(w=(pw/3), h=ch, txt="Cell 4a", border=1, ln=0)
pdf.cell(w=(pw/3)*2, h=ch, txt="Cell 4b", border=1, ln=1)pdf.set_xy(x=10, y= 220) # or use pdf.ln(50)
pdf.cell(w=0, h=ch, txt="Cell 5", border=1, ln=1)pdf.output(f'./example.pdf', 'F')
Header and Footer
You can also specify a header and footer shown on each page in the PDF document. For this, you need to overwrite the header() and footer() methods in a custom class. Don’t forget to use an instance of your custom class instead of the FPDF class.
# Custom class to overwrite the header and footer methods
class PDF(FPDF):
def __init__(self):
super().__init__()
def header(self):
self.set_font('Arial', '', 12)
self.cell(0, 10, 'Header', 1, 1, 'C')
def footer(self):
self.set_y(-15)
self.set_font('Arial', '', 12)
self.cell(0, 10, 'Footer', 1, 0, 'C')pdf = PDF() # Instance of custom class
pdf.add_page()
pdf.set_font('Arial', '', 12)
pdf.cell(w=0, h=255, txt = "Body", border = 1, ln = 1, align = 'C')pdf.output(f'./example.pdf', 'F')
Now that you have understood how to lay out a PDF document, let’s fill the cells with some content.
Styling Text
The fpdf library offers you the basics to style your text:
- With the
set_font()method, you can set the font, the font size, and the emphasis (regular, bold, italic). - In the
cellmethod, you can define the text alignment with thealignparameter. - To fill the background of a cell, you need to define a color with the
set_fill_color()method and also definefill = Truein thecell()method. - To change the color of a cell’s text, you can define a color with the
set_text_color()method.
pdf = FPDF()
pdf.add_page()pdf.set_font('Arial', '', 16)
pdf.cell(w=0, h=10, txt="This is regular text.", ln=1)pdf.set_font('Arial', 'B', 16)
pdf.cell(w=0, h=10, txt="This is bold text.", ln=1)pdf.set_font('Arial', 'I', 16)
pdf.cell(w=0, h=10, txt="This is italic text.", ln=1)pdf.set_font('Arial', '', 16) # Reset text back to regularpdf.cell(w=0, h=10, txt="This is left aligned text.", ln=1,
align='L')
pdf.cell(w=0, h=10, txt="This is center aligned text.", ln=1,
align='C')
pdf.cell(w=0, h=10, txt="This is right aligned text.", ln=1,
align='R')pdf.set_fill_color(r= 0, g= 128, b = 0)
pdf.cell(w=0, h=10, txt="This is text with filled background.", ln=1,
fill=True)pdf.set_text_color(r= 0, g= 128, b = 0)
pdf.cell(w=0, h=10, txt="This is colored text.", ln=1)pdf.output(f'./example.pdf', 'F')
Line and Page Breaks
If you need a block of longer text, the cell() method is insufficient because it doesn’t allow for line or page breaks, as you can see below.
For this purpose, you should use the multi_cell() method instead, which can handle line and page breaks.
import lorem # Use this package to showcase long textspdf = FPDF()
pdf.add_page()
pdf.set_font('Arial', '', 16)pdf.cell(w=0, h=50, txt="This and the below cells are regular cells." , border=1, ln=1)pdf.cell(w=0, h=50, txt="Example: " + lorem.text(), border=1, ln=1)pdf.multi_cell(w=0, h=50, txt="This and the below cells are multi cells.", border=1, )pdf.multi_cell(w=0, h=5, txt="Example: " + lorem.text(), border=1, )pdf.output(f'./example.pdf', 'F')
Template
With everything you have learned so far, you can now create a simple template like the one shown below. We will use this for the following examples.
# cell height
ch = 8class PDF(FPDF):
def __init__(self):
super().__init__()
def header(self):
self.set_font('Arial', '', 12)
self.cell(0, 8, 'Header', 0, 1, 'C')
def footer(self):
self.set_y(-15)
self.set_font('Arial', '', 12)
self.cell(0, 8, f'Page {self.page_no()}', 0, 0, 'C')pdf = PDF()
pdf.add_page()
pdf.set_font('Arial', 'B', 24)
pdf.cell(w=0, h=20, txt="Title", ln=1)pdf.set_font('Arial', '', 16)
pdf.cell(w=30, h=ch, txt="Date: ", ln=0)
pdf.cell(w=30, h=ch, txt="01/01/2022", ln=1)
pdf.cell(w=30, h=ch, txt="Author: ", ln=0)
pdf.cell(w=30, h=ch, txt="Max Mustermann", ln=1)pdf.ln(ch)
pdf.multi_cell(w=0, h=5, txt=lorem.paragraph())pdf.ln(ch)
pdf.multi_cell(w=0, h=5, txt=lorem.paragraph())pdf.output(f'./example.pdf', 'F')
For the following examples, we will be using a small fictional dataset.
import pandas as pddf = pd.DataFrame(
{'feature 1' : ['cat 1', 'cat 2', 'cat 3', 'cat 4'],
'feature 2' : [400, 300, 200, 100]
})
Aside from text, you might need to add plots to your PDF report.
To add plots to your PDF report, you first need to save your Matplotlib plots as images (e.g., PNG files).
import matplotlib.pyplot as plt
import seaborn as snsfig, ax = plt.subplots(1,1, figsize = (6, 4))sns.barplot(data =  df, x = 'feature 1', y = 'feature 2')
plt.title("Chart")plt.savefig('./example_chart.png',
transparent=False,
facecolor='white',
bbox_inches="tight")
Once your Matplotlib plot is saved as an image, you can add it to the report with the image() method.
pdf = PDF()
pdf.add_page()
pdf.set_font('Arial', 'B', 24)
pdf.cell(w=0, h=20, txt="Title", ln=1)pdf.set_font('Arial', '', 16)
pdf.cell(w=30, h=ch, txt="Date: ", ln=0)
pdf.cell(w=30, h=ch, txt="01/01/2022", ln=1)
pdf.cell(w=30, h=ch, txt="Author: ", ln=0)
pdf.cell(w=30, h=ch, txt="Max Mustermann", ln=1)pdf.ln(ch)
pdf.multi_cell(w=0, h=5, txt=lorem.paragraph())pdf.image('./example_chart.png',
x = 10, y = None, w = 100, h = 0, type = 'PNG')pdf.ln(ch)
pdf.multi_cell(w=0, h=5, txt=lorem.paragraph())pdf.output(f'./example.pdf', 'F')
Unfortunately, there is no simple way to add a pandas DataFrame to a PDF report with the FPDF library. Although adding a pandas DataFrame as a table to a PDF report requires some light coding, it is not difficult either: By using the cell() method with border=1 and effectively utilizing the ln parameter, you can iterate over the DataFrame to create a table.
pdf = PDF()
pdf.add_page()
pdf.set_font('Arial', 'B', 24)
pdf.cell(w=0, h=20, txt="Title", ln=1)pdf.set_font('Arial', '', 16)
pdf.cell(w=30, h=ch, txt="Date: ", ln=0)
pdf.cell(w=30, h=ch, txt="01/01/2022", ln=1)
pdf.cell(w=30, h=ch, txt="Author: ", ln=0)
pdf.cell(w=30, h=ch, txt="Max Mustermann", ln=1)pdf.ln(ch)
pdf.multi_cell(w=0, h=5, txt=lorem.paragraph())pdf.image('./example_chart.png', x = 10, y = None, w = 100, h = 0, type = 'PNG', link = '')pdf.ln(ch)
pdf.multi_cell(w=0, h=5, txt=lorem.paragraph())pdf.ln(ch)# Table Header
pdf.set_font('Arial', 'B', 16)
pdf.cell(w=40, h=ch, txt='Feature 1', border=1, ln=0, align='C')
pdf.cell(w=40, h=ch, txt='Feature 2', border=1, ln=1, align='C')# Table contents
pdf.set_font('Arial', '', 16)
for i in range(0, len(df)):
pdf.cell(w=40, h=ch,
txt=df['feature 1'].iloc[i],
border=1, ln=0, align='C')
pdf.cell(w=40, h=ch,
txt=df['feature 2'].iloc[i].astype(str),
border=1, ln=1, align='C')pdf.output(f'./example.pdf', 'F')
Technically, you could also convert your pandas DataFrame to a Matplotlib table, save it as an image and insert the table as an image to the PDF. But I tried this out, so you don’t have to: It’s not very pretty.
Although critics say there are better alternatives to the fpdf library, it is simple to use.
This article showed you:
Below you can copy the template code that generates the following PDF and adjust it for your purposes.
Denial of responsibility! Techno Blender is an automatic aggregator of the all world’s media. In each content, the hyperlink to the primary source is specified. All trademarks belong to their rightful owners, all materials to their authors. If you are the owner of the content and do not want us to publish your materials, please contact us by email – [email protected]. The content will be deleted within 24 hours.