
How to cross validate your panel data in Python
An introduction to panel data cross validation using PanelSplit
Motivation: As someone who works with panel data, I often need to perform cross validation. This involves training up to a certain point in time, testing on a subset of observations, training up to a further point in time, testing on a different subset of observations, and iteratively continuing this process on a panel data set. Sound familiar? This can be really frustrating to implement manually. To make things easier, I’ve created a package called PanelSplit that can help when working with panel data.
This article shows how you can use PanelSplit when working with panel data; from feature engineering, to hyper-parameter tuning, to generating predictions, PanelSplit is here to help!
What is panel data?
By panel data, I mean data where there are multiple entities over time. These entities could be countries, people, organizations, or any other unit of analysis. Multiple observations are recorded over time for these multiple entities.
What is cross validation?
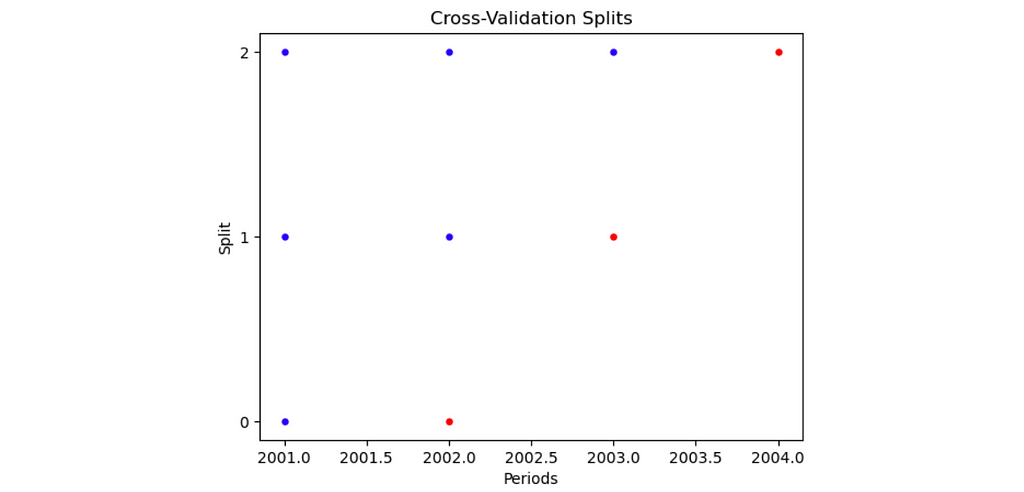
Say we want to get estimates of how good our predictions are when we use a model. How can we do this? The standard approach is cross validation, which involves splitting the data up into successive folds, each with its unique training and testing set. The visualization below shows what this looks like for time series data.

While there is already a scikit-learn function to do time series cross validation called TimeSeriesSplit, it doesn’t work with panel data. Rather than being a single time series for one entity, panel data has multiple entities and we need a tool that allows us to work with multiple entities.
This is where PanelSplit comes in. PanelSplit is a package that allows us to generalize TimeSeriesSplit to panel data. It also offers functionality for transforming, predicting, and much more, but in this introductory article I’ll cover the just basics.
Performing cross validation with PanelSplit
Now that we’ve introduced what panel data is and what cross validation looks like in this setting, let’s see how to do cross validation using PanelSplit.
First, let’s generate some example data to work with:
import pandas as pd
import numpy as np

# generate example data
num_countries = 3
years = range(2000, 2005)
num_years = len(years)

data = {
    'country_id': [c for c in range(1, num_countries + 1) for _ in years],
    'year': [year for _ in range(num_countries) for year in years],
    'y': np.random.normal(0, 1, num_countries * num_years),
    'x1': np.random.normal(0, 1, num_countries * num_years),
    'x2': np.random.normal(0, 1, num_countries * num_years)
}

panel_data = pd.DataFrame(data)

# display the generated panel data
display(panel_data)

After generating our panel data set, we can now apply PanelSplit.
Initializing PanelSplit
When we initialize PanelSplit, we define the cross validation approach that we are going to use.
- The periods argument takes the time series. In this case the series is the year column.
- n_splits, gap, and test_size are all arguments used by TimeSeriesSplit to split up the time series.
- By specifying plot=True, a visualization is produced describing the train and test sets within each split.
!pip install panelsplit
from panelsplit import PanelSplit

panel_split = PanelSplit(periods = panel_data.year, n_splits = 3, gap = 0, test_size=1, plot=True)
Understanding how PanelSplit works
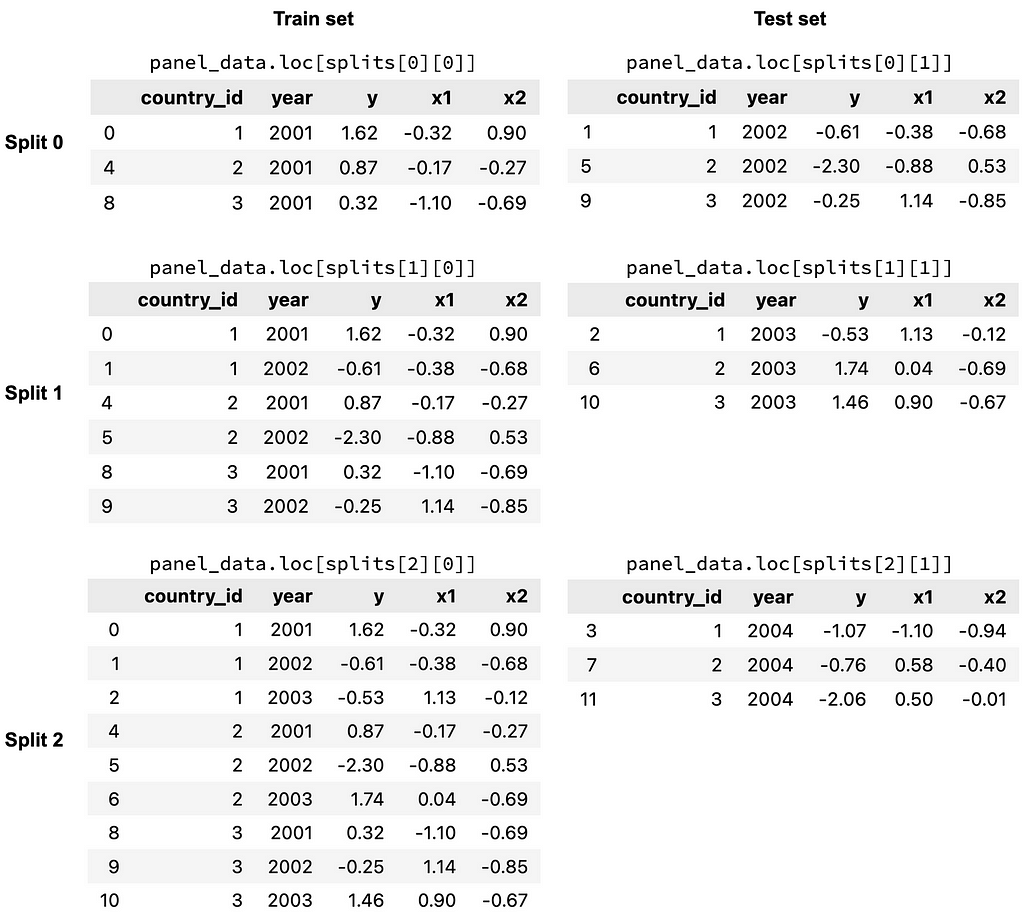
To get a better idea of what the splits look like, let’s use the split() function to return the different train and test sets for each split.
splits = panel_split.split()
The splits object contains the 3 splits of the cross validation procedure. Within each split, there is a list, which consists of the train indices (the first item) and test indices (the second item). The indices are True and False values, indicating whether or not a row is in a particular train/test set for a particular split. These indices can be used to filter for different subsets of the data, as shown in the figure below.
Hyper-parameter tuning
Now that we’ve created an instance of PanelSplit, let’s do some hyper-parameter tuning!
Here we do a basic hyper-parameter search with a Ridge model, specifying the cv argument for GridSearchCV to be panel_split. During GridSearchCV’s fit procedure it calls panel_split’s split() function, returing the indices for each train and test for each split. It uses these indices to filter the data that are provided as the X and y arguments in the fit() function.
from sklearn.linear_model import Ridge
from sklearn.model_selection import GridSearchCV

param_grid = {'alpha':[.1, .5]} # define the hyper-parameter grid space

# define the gridsearch and call fit, specifying panel_split for the cv argument
gridsearch = GridSearchCV(estimator = Ridge(), param_grid=param_grid, cv=panel_split)
gridsearch.fit(X = panel_data[['x1','x2']], y = panel_data['y'])

print(gridsearch.best_params_)

Hooray! We’ve found the optimal set of hyper-parameters. Now we can use these to predict.
Note: In a real setting we’d differentiate between the test set used for hyper-parameter tuning and the test set used for evaluating performance, but for this example let’s keep the validation set and the test set the same.
Generating predictions with cross_val_fit_predict
Generating predictions is really easy with PanelSplit.
Using cross_val_fit_predict, we specify that we want to use our best Ridge model, our X and y, and PanelSplit will fit on each training set and predict on each test set, for each split.
predictions, models = panel_split.cross_val_fit_predict(estimator = Ridge(gridsearch.best_params_),
                                                   X = panel_data[['x1','x2']],
                                                   y = panel_data['y'])
The predictions as well as the fitted models are returned. If we want to include the identifiers for the predictions, we can generate labels using gen_test_labels and then create a new Pandas Series in our predictions_df DataFrame.
predictions_df = panel_split.gen_test_labels(panel_data[['country_id','year']])
predictions_df['y_pred'] = y_pred
display(predictions_df)

What else can PanelSplit do?
This is just a basic demo, but PanelSplit can do so much more! For example:
- With cross_val_fit_transform we can fit on training sets and transform on test sets. If we have missing features that need imputation this is really helpful.
- What if we want to scale the data and each split needs its own ‘snapshot’ of the data in order to keep the scaling transformations separate? We can use gen_snapshots to do this! Or use a scikit-learn pipeline as the estimator in cross_val_fit_predict 🙂
- What if we are missing a time period? By using the unique periods argument with the drop_splits argument upon initialization, PanelSplit can handle this and drops splits where there aren’t any observations.
If you’re looking to see some more examples and want to try PanelSplit out for yourself, check out the Jupyter notebook I created where I cover some additional capabilities.
This is the first package I have written, so I learned a lot working on this project. Thank you for reading, and I hope PanelSplit helps you in your next panel data project!
Note: Unless otherwise noted, all images are by the author.
How to cross validate your panel data in Python was originally published in Towards Data Science on Medium, where people are continuing the conversation by highlighting and responding to this story.

An introduction to panel data cross validation using PanelSplit
Motivation: As someone who works with panel data, I often need to perform cross validation. This involves training up to a certain point in time, testing on a subset of observations, training up to a further point in time, testing on a different subset of observations, and iteratively continuing this process on a panel data set. Sound familiar? This can be really frustrating to implement manually. To make things easier, I’ve created a package called PanelSplit that can help when working with panel data.
This article shows how you can use PanelSplit when working with panel data; from feature engineering, to hyper-parameter tuning, to generating predictions, PanelSplit is here to help!
What is panel data?
By panel data, I mean data where there are multiple entities over time. These entities could be countries, people, organizations, or any other unit of analysis. Multiple observations are recorded over time for these multiple entities.
What is cross validation?
Say we want to get estimates of how good our predictions are when we use a model. How can we do this? The standard approach is cross validation, which involves splitting the data up into successive folds, each with its unique training and testing set. The visualization below shows what this looks like for time series data.
While there is already a scikit-learn function to do time series cross validation called TimeSeriesSplit, it doesn’t work with panel data. Rather than being a single time series for one entity, panel data has multiple entities and we need a tool that allows us to work with multiple entities.
This is where PanelSplit comes in. PanelSplit is a package that allows us to generalize TimeSeriesSplit to panel data. It also offers functionality for transforming, predicting, and much more, but in this introductory article I’ll cover the just basics.
Performing cross validation with PanelSplit
Now that we’ve introduced what panel data is and what cross validation looks like in this setting, let’s see how to do cross validation using PanelSplit.
First, let’s generate some example data to work with:
import pandas as pd
import numpy as np

# generate example data
num_countries = 3
years = range(2000, 2005)
num_years = len(years)

data = {
    'country_id': [c for c in range(1, num_countries + 1) for _ in years],
    'year': [year for _ in range(num_countries) for year in years],
    'y': np.random.normal(0, 1, num_countries * num_years),
    'x1': np.random.normal(0, 1, num_countries * num_years),
    'x2': np.random.normal(0, 1, num_countries * num_years)
}

panel_data = pd.DataFrame(data)

# display the generated panel data
display(panel_data)
After generating our panel data set, we can now apply PanelSplit.
Initializing PanelSplit
When we initialize PanelSplit, we define the cross validation approach that we are going to use.
- The periods argument takes the time series. In this case the series is the year column.
- n_splits, gap, and test_size are all arguments used by TimeSeriesSplit to split up the time series.
- By specifying plot=True, a visualization is produced describing the train and test sets within each split.
!pip install panelsplit
from panelsplit import PanelSplit

panel_split = PanelSplit(periods = panel_data.year, n_splits = 3, gap = 0, test_size=1, plot=True)
Understanding how PanelSplit works
To get a better idea of what the splits look like, let’s use the split() function to return the different train and test sets for each split.
splits = panel_split.split()
The splits object contains the 3 splits of the cross validation procedure. Within each split, there is a list, which consists of the train indices (the first item) and test indices (the second item). The indices are True and False values, indicating whether or not a row is in a particular train/test set for a particular split. These indices can be used to filter for different subsets of the data, as shown in the figure below.
Hyper-parameter tuning
Now that we’ve created an instance of PanelSplit, let’s do some hyper-parameter tuning!
Here we do a basic hyper-parameter search with a Ridge model, specifying the cv argument for GridSearchCV to be panel_split. During GridSearchCV’s fit procedure it calls panel_split’s split() function, returing the indices for each train and test for each split. It uses these indices to filter the data that are provided as the X and y arguments in the fit() function.
from sklearn.linear_model import Ridge
from sklearn.model_selection import GridSearchCV

param_grid = {'alpha':[.1, .5]} # define the hyper-parameter grid space

# define the gridsearch and call fit, specifying panel_split for the cv argument
gridsearch = GridSearchCV(estimator = Ridge(), param_grid=param_grid, cv=panel_split)
gridsearch.fit(X = panel_data[['x1','x2']], y = panel_data['y'])

print(gridsearch.best_params_)
Hooray! We’ve found the optimal set of hyper-parameters. Now we can use these to predict.
Note: In a real setting we’d differentiate between the test set used for hyper-parameter tuning and the test set used for evaluating performance, but for this example let’s keep the validation set and the test set the same.
Generating predictions with cross_val_fit_predict
Generating predictions is really easy with PanelSplit.
Using cross_val_fit_predict, we specify that we want to use our best Ridge model, our X and y, and PanelSplit will fit on each training set and predict on each test set, for each split.
predictions, models = panel_split.cross_val_fit_predict(estimator = Ridge(gridsearch.best_params_),
                                                   X = panel_data[['x1','x2']],
                                                   y = panel_data['y'])
The predictions as well as the fitted models are returned. If we want to include the identifiers for the predictions, we can generate labels using gen_test_labels and then create a new Pandas Series in our predictions_df DataFrame.
predictions_df = panel_split.gen_test_labels(panel_data[['country_id','year']])
predictions_df['y_pred'] = y_pred
display(predictions_df)
What else can PanelSplit do?
This is just a basic demo, but PanelSplit can do so much more! For example:
- With cross_val_fit_transform we can fit on training sets and transform on test sets. If we have missing features that need imputation this is really helpful.
- What if we want to scale the data and each split needs its own ‘snapshot’ of the data in order to keep the scaling transformations separate? We can use gen_snapshots to do this! Or use a scikit-learn pipeline as the estimator in cross_val_fit_predict 🙂
- What if we are missing a time period? By using the unique periods argument with the drop_splits argument upon initialization, PanelSplit can handle this and drops splits where there aren’t any observations.
If you’re looking to see some more examples and want to try PanelSplit out for yourself, check out the Jupyter notebook I created where I cover some additional capabilities.
This is the first package I have written, so I learned a lot working on this project. Thank you for reading, and I hope PanelSplit helps you in your next panel data project!
Note: Unless otherwise noted, all images are by the author.
How to cross validate your panel data in Python was originally published in Towards Data Science on Medium, where people are continuing the conversation by highlighting and responding to this story.
Denial of responsibility! Techno Blender is an automatic aggregator of the all world’s media. In each content, the hyperlink to the primary source is specified. All trademarks belong to their rightful owners, all materials to their authors. If you are the owner of the content and do not want us to publish your materials, please contact us by email – [email protected]. The content will be deleted within 24 hours.