
Implementing a CDC Performance Feature
TiCDC is a change data capture (CDC) solution that replicates incremental data changes in real time for TiDB, a distributed SQL database. Previously, TiCDC faced a challenge in its communication with downstream TiDB clusters using query commands, which led to higher CPU usage on SQL parsing and compiling. This issue was particularly significant in larger distributed database systems, where the increased workload could reduce performance and slow down data replication times. Moreover, the lack of plan cache hits further exacerbated the problem, resulting in even slower performance.
Thanks to ChatGPT, a natural language processing and artificial intelligence tool from OpenAI, I was able to resolve these issues. I implemented a TiCDC performance feature that improves the communication between TiCDC and downstream TiDB clusters.
What Do We Need From the TiCDC Performance Feature?
The TiCDC performance feature has clear goals: lower CPU usage on SQL parsing and compiling, and increased plan cache hits, which improves the communication between TiCDC and downstream TiDB clusters. This feature would help optimize TiCDC performance and ensure faster and more reliable data replication across multiple TiDB clusters.
Seeking Help from ChatGPT
My role at PingCAP is QA engineer. Due to limited development resources, I took on the development work, despite not being a full-time developer. This presented additional challenges as I lacked the experience and knowledge to design and implement such a feature.
On the other hand, I recognized how important this feature could be to TiCDC’s performance and reliability, so I was eager to take on the challenge. To bridge my knowledge gap, I turned to ChatGPT, which proved to be an invaluable resource. By leveraging the power of ChatGPT’s natural language processing capabilities, I quickly gained an understanding of the requirements and challenges involved in developing the performance feature. This allowed me to work more effectively with other team members and stakeholders and ultimately deliver a high-quality performance feature that met the needs of the TiCDC project.
Initial Results and Challenges
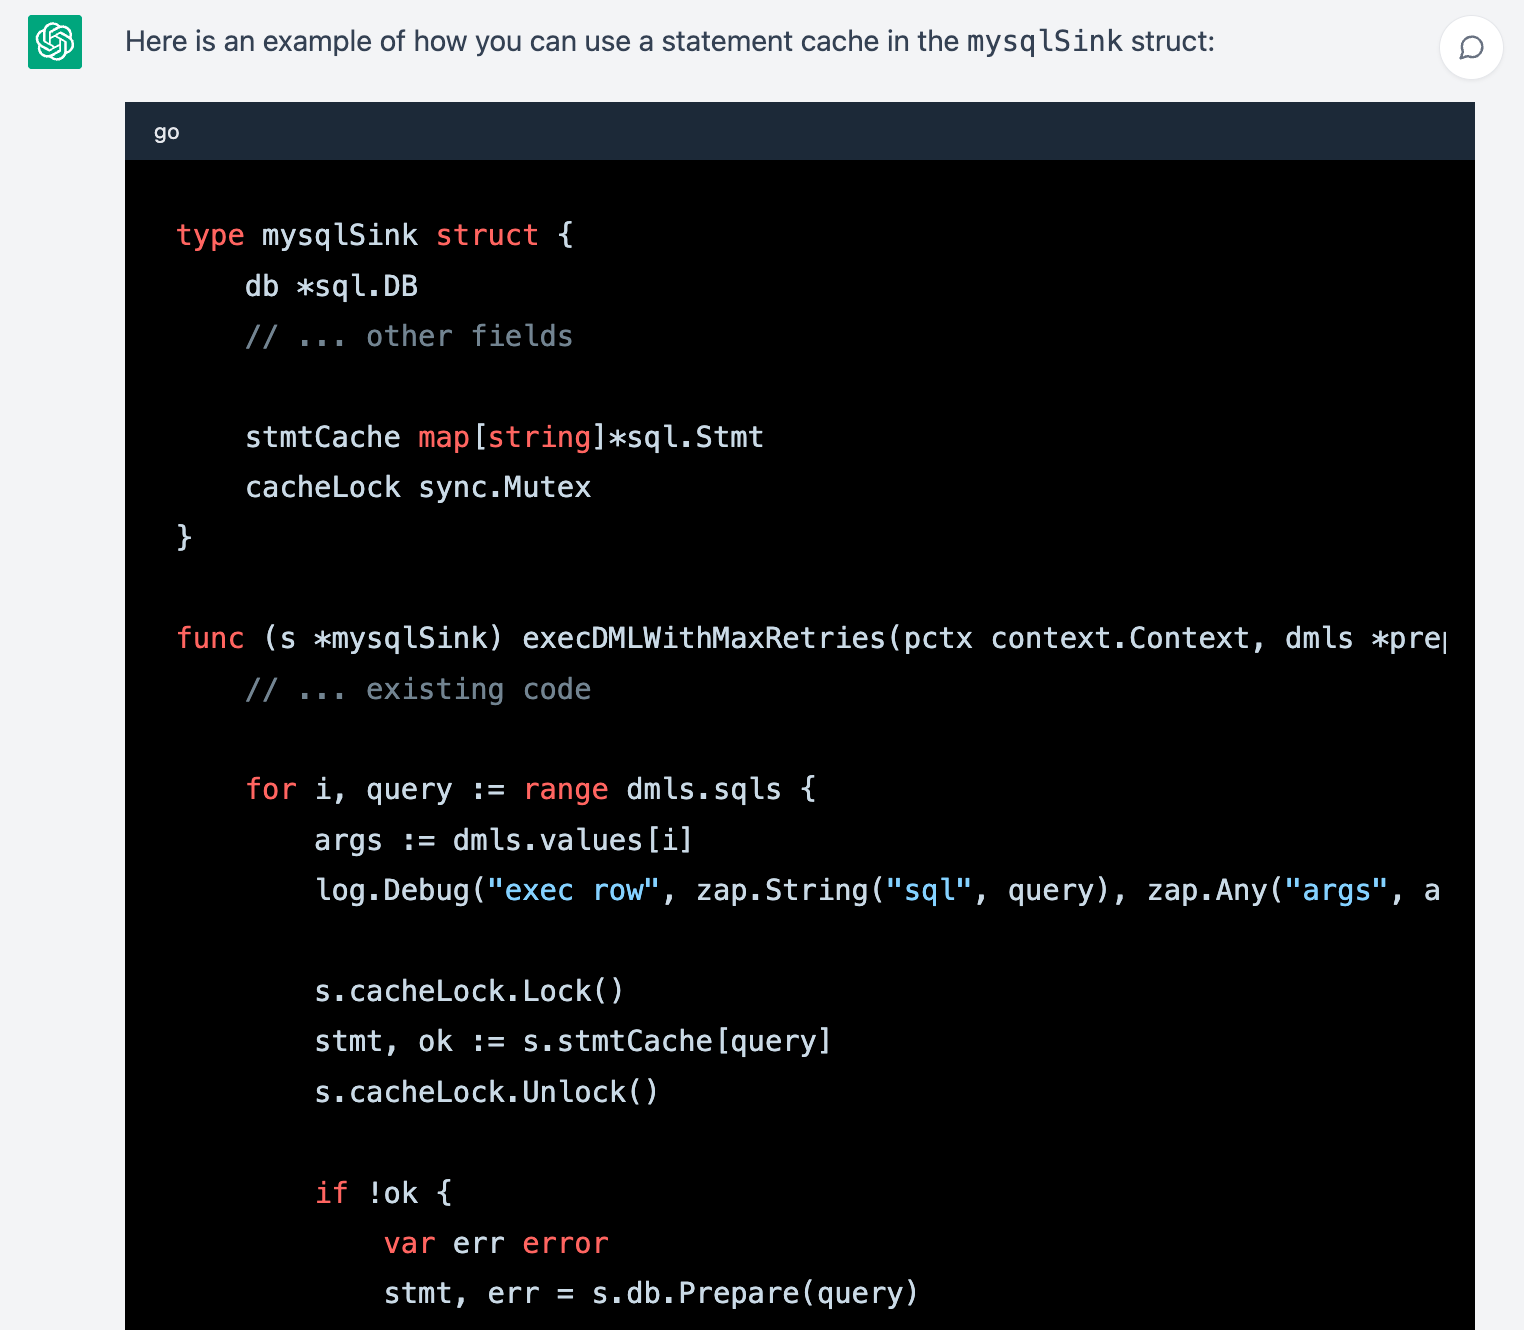
The module communicating with the downstream database in TiCDC is MySQL sinker. After reviewing TiCDC’s code, I was able to identify the main logic of MySQL sinker in the `execDMLWithMaxRetries` function. I shared the code in mysql.go with ChatGPT, and asked it to rewrite the code to implement a statement cache.
ChatGPT provided a helpful starting point for my analysis, and I was able to gain a deeper understanding of the function’s purpose and logic.
ChatGPT’s initial code prompt
It even reminded me to properly initiate and release the cache map. Nice!
|
Go // release the map in close Interface |
Making the Code Work
MySQL sinker initializes a connection pool to communicate with downstream databases when started. The size of the connection pool is determined by the worker count configuration. The connection pool is created by a DB type defined in the Golang sql package. To ensure transactional semantics when syncing data changes to a downstream database, MySQL sinker uses a database transaction type called Tx.
In the first response of ChatGPT, the cache statements are created by DB.Prepare. However, cache statements created by DB.Prepare cannot be executed directly by the Tx type. After reviewing the Golang sql package, I discovered that I could use the Tx.Stmt function to return a transaction-specific prepared statement from an existing statement. Then I told ChatGPT about the Tx.Stmt function. It provided the following example:
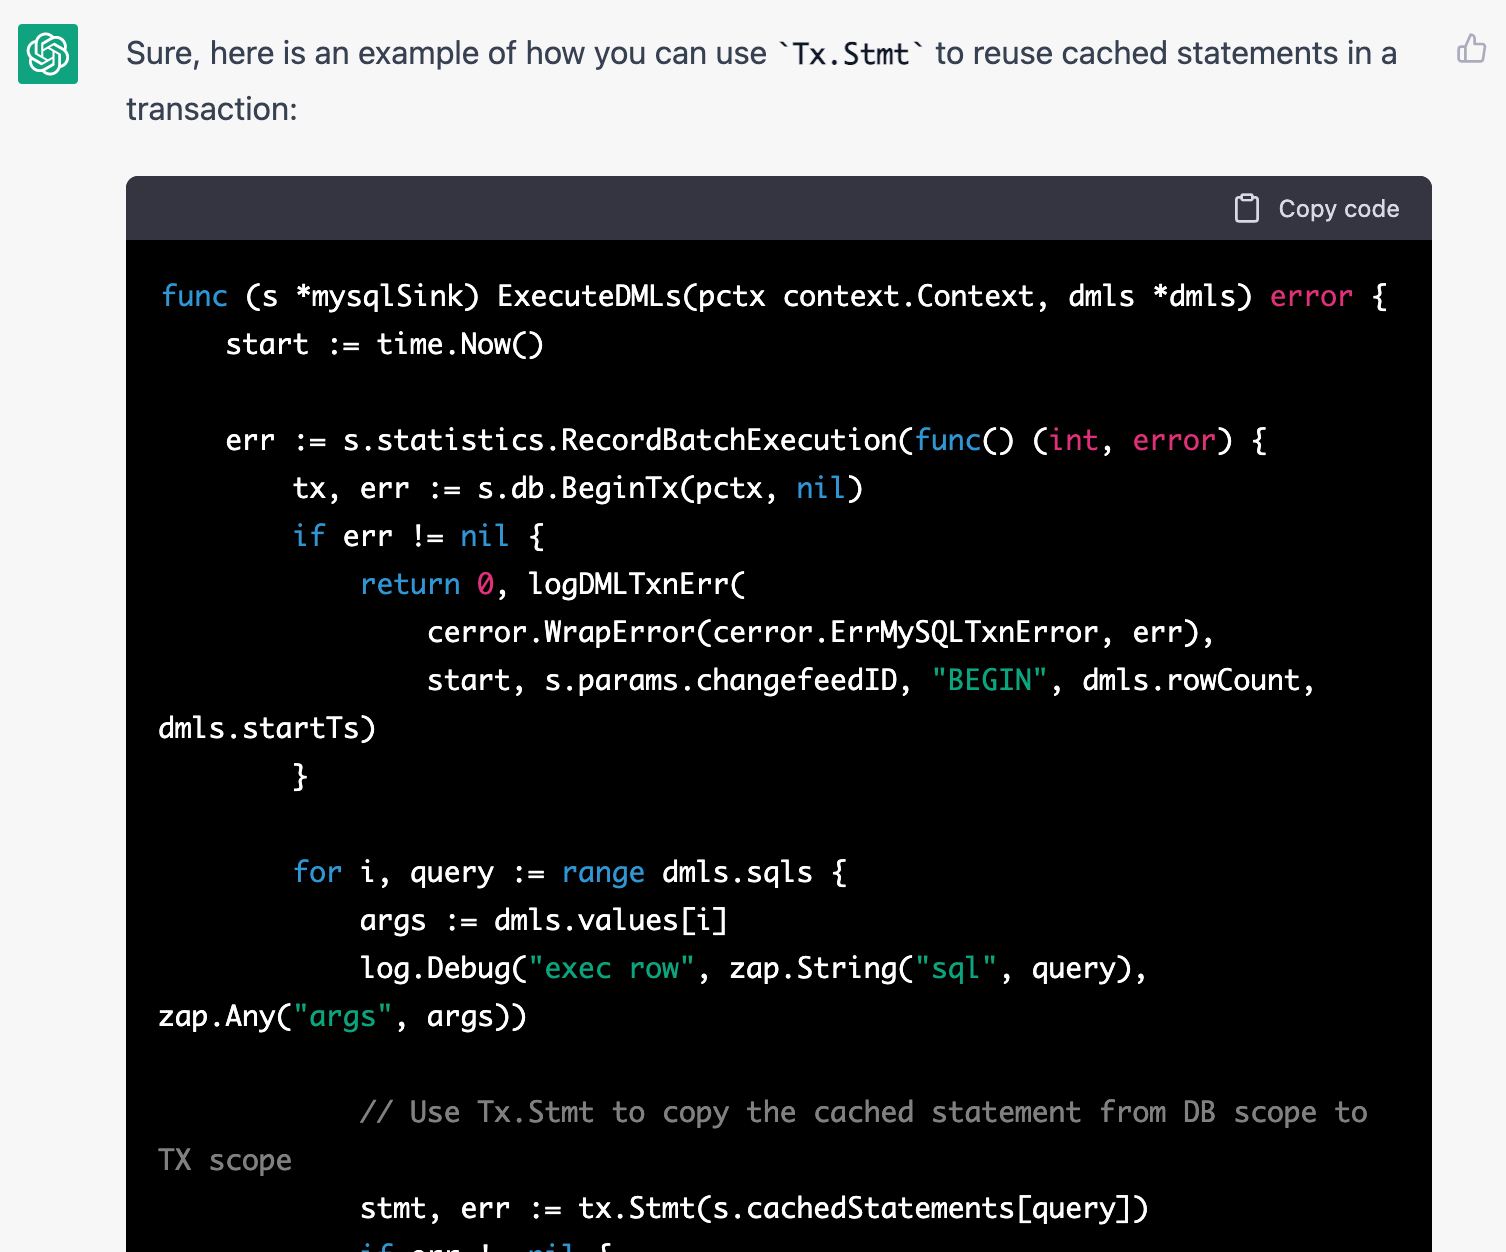
ChatGPT ‘s proposed code sample to integrate with tx.Stmt
After I put the code together, the initial testing showed that the new code used a prepared statement interface as expected. You can see the code here.
A Happy Initial Result With 100% Plan Cache Hit
I used Sysbench, a popular open-source software tool to benchmark MySQL-compatible databases to compare the baseline and the new code.
The performance overview dashboard shown below illustrates the impact of the new implementation on TiCDC’s downstream communication with TiDB. The updated code, shown on the right side of the dashboard, uses the StmtExecute command and has resulted in a plan cache hit rate of 100%. In contrast, the baseline implementation on the left side only uses the query command, resulting in zero plan cache hits.
These performance metrics demonstrate the effectiveness of the updated implementation. It not only improves plan cache hit rates but also optimizes downstream communication between TiCDC and TiDB.
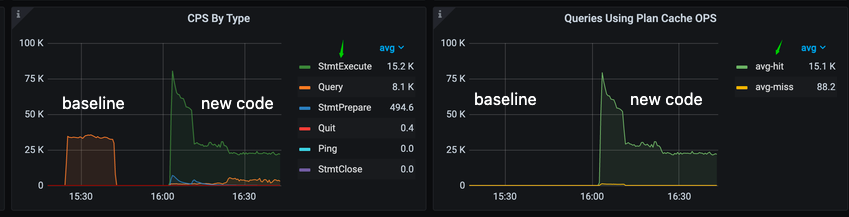
The Performance Overview dashboard for the downstream TiDB cluster
Performance Degradation of the First Version
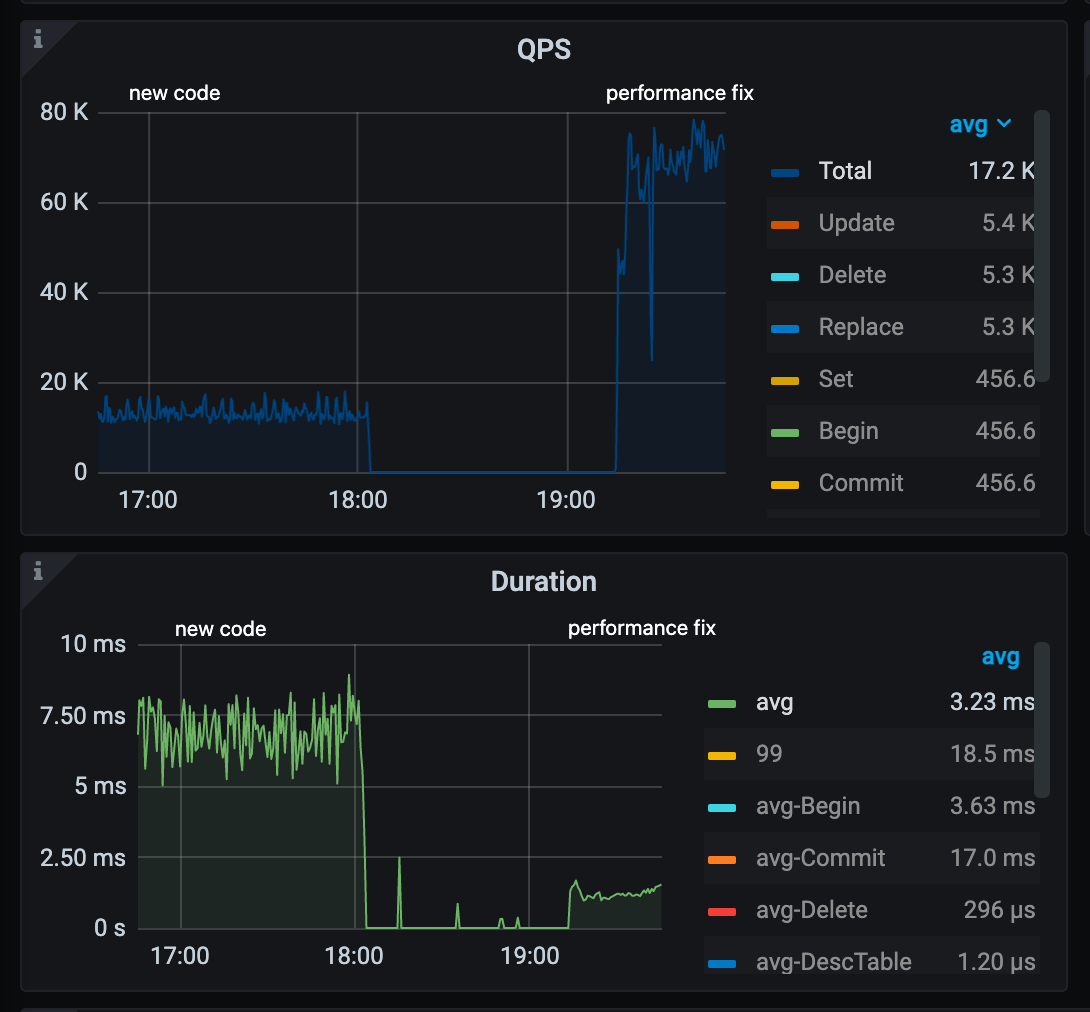
The chart below illustrates the performance metrics of TiCDC’s baseline implementation (left side) and the updated code (right side). Contrary to expectations, the new code has degraded performance. Queries per Second (QPS) have decreased, and query duration has increased.
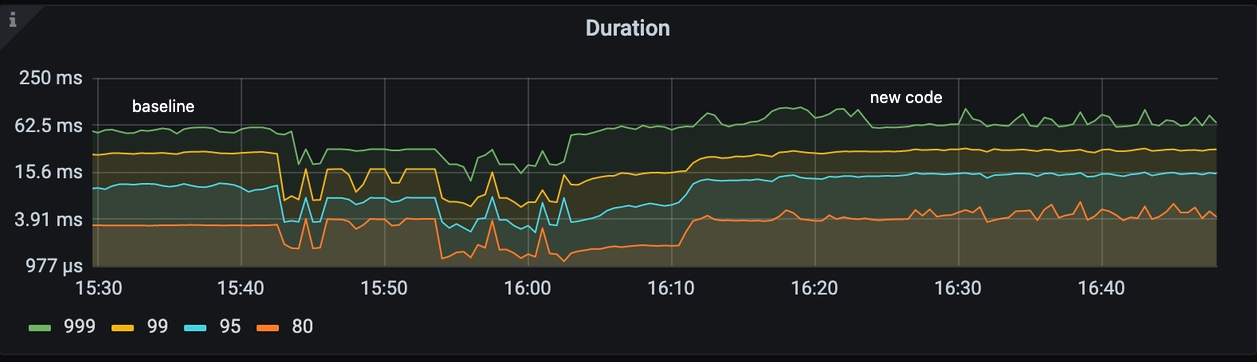
Query duration for downstream TiDB Cluster
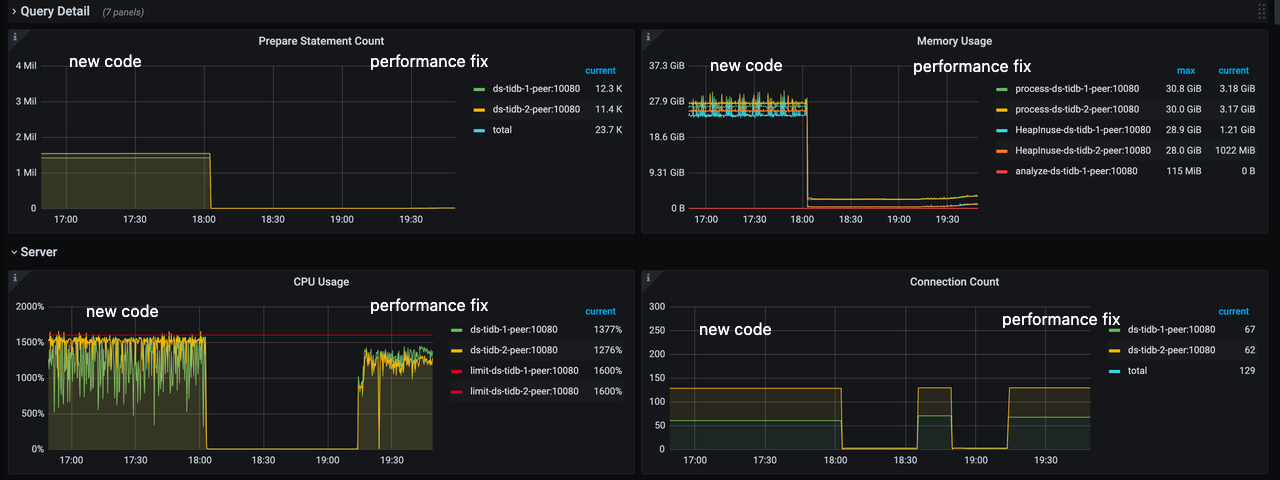
The new code cached the prepared statements as expected, but the total number of prepared statements per TiDB instance was more than a 1 million. This results in high CPU usage and approximately 27 GB of memory usage.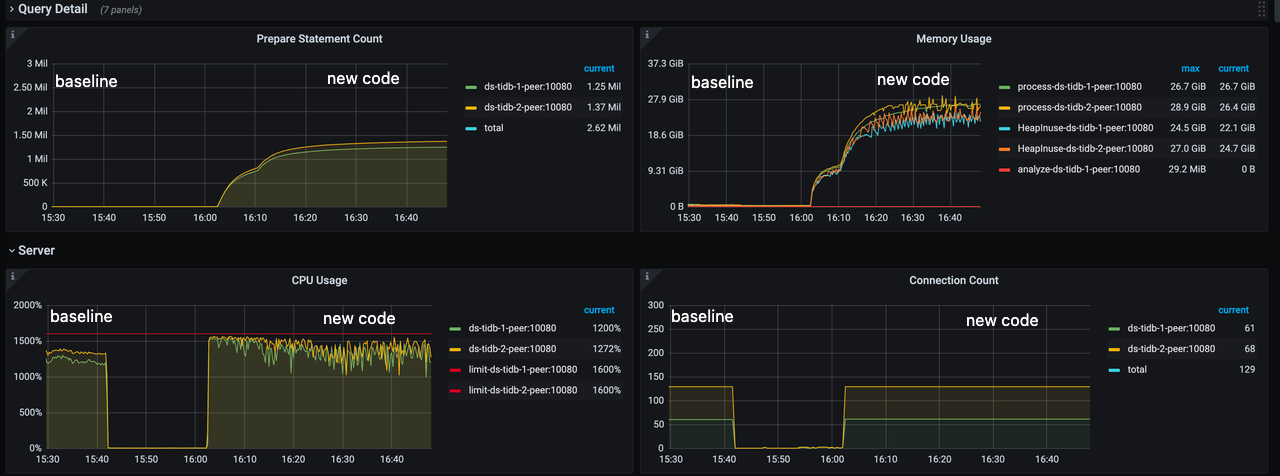
TiDB dashboard for downstream TiDB clusters
The TiDB heap profile chart also revealed that the cached prepared statements used most of the memory.
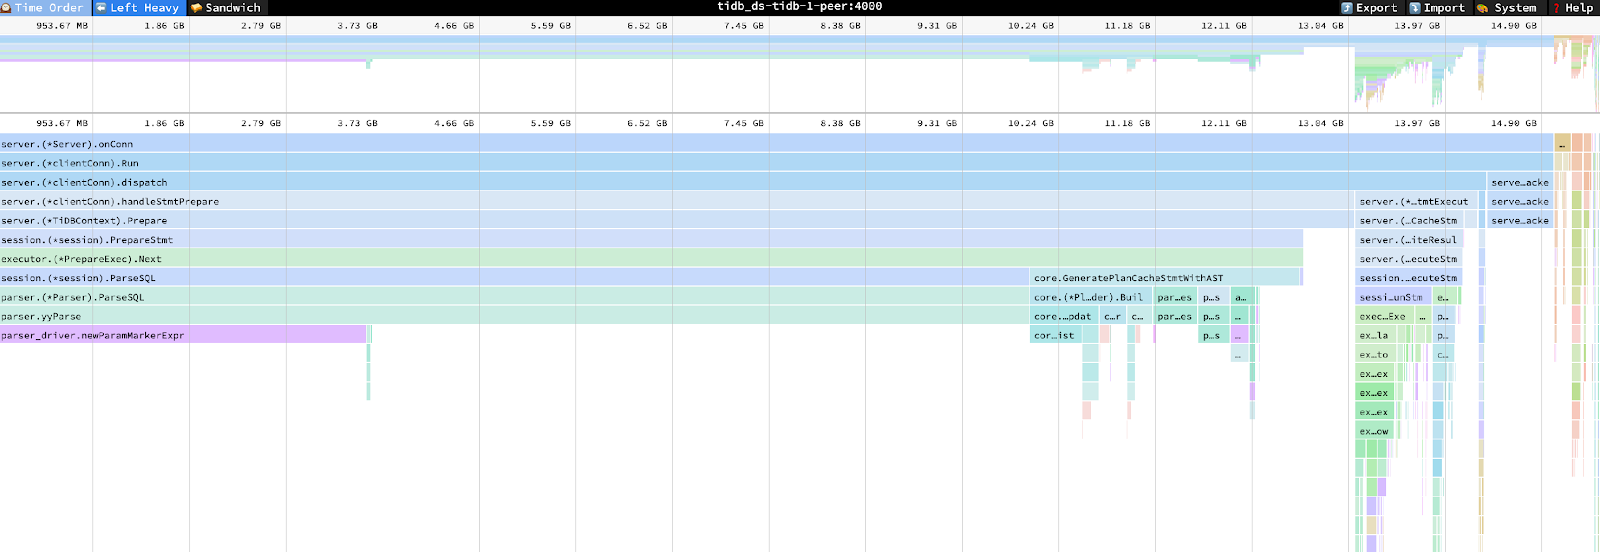
TiDB heap profile
The TiDB CPU profile indicates the significant CPU usage on the memory tracker and Golang runtime, due to high memory pressure.
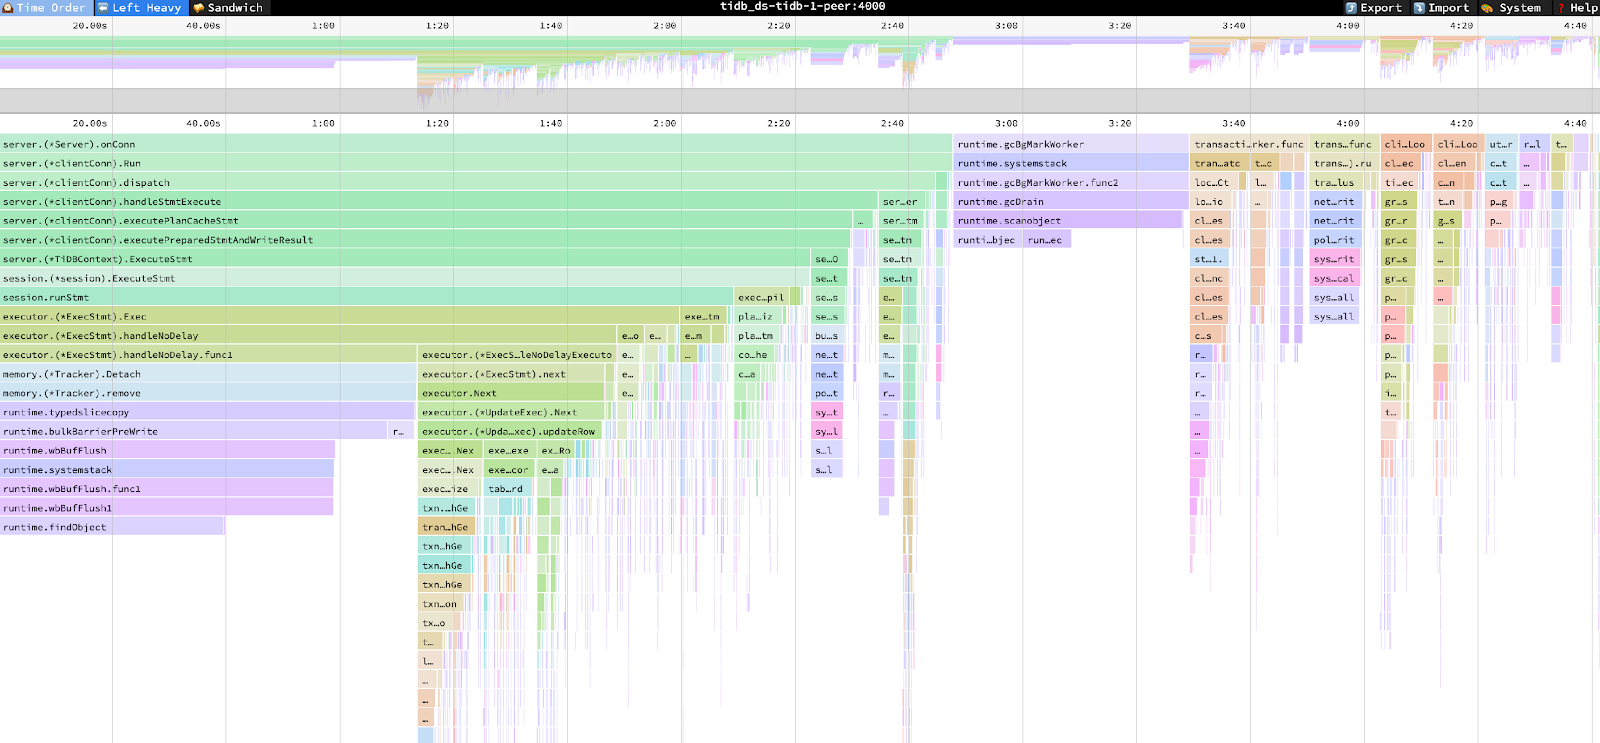
TiDB CPU profile
Solving the Performance Issue
Analyzing the Root Cause
In this particular scenario, the number of worker count is 128. MySQL sink initializes the size of the connection pool accordingly, so there are 128 connections. With 32 tables in the sysbench workload. For each Sysbench table, there are three types of update statements, each statement is cached across all the connections. This leads to an estimated total of 1,572,864 (128*128*32*3) prepared statements. As a result, the memory usage on each TiDB instance is approximately 27 GB.
The code snippet below illustrates how the statement cache is initialized for each worker.
|
Go |
Fixing Performance Degradation
By using a single global statement cache and implementing sync.Mutex, I was able to resolve the performance degradation issue. sync.Mutex is a synchronization primitive in Go. It is used to implement mutual exclusion locks and protect the global statement cache from concurrent access. These changes significantly improved performance, with a 4x increase in QPS and a reduction in average latency from 7.5 ms to 1 ms.
Moreover, the total number of prepared statements for each TiDB instance was reduced from 1.5 million to 12,000, which considerably reduced memory usage from approximately 27 GB to 3.5 GB.
The code snippet below illustrates how to deploy a single global statement cache for all the workers. Please check the pull request for more full code.
|
Go backends := make([]*mysqlBackend, 0, cfg.WorkerCount) |
QPS and latency difference
TiDB CPU/memory usage
Benchmarking the Implementation
When benchmarked using the sysbench workload involving 32 tables, the new statement cache feature resulted in significant improvements over the baseline implementation.
|
Metric |
v6.5.0-baseline |
v6.5.0-prep-stmt-cache |
Improvement |
|
Checkpoint lag (s) |
>10.0 |
0.52 |
95% |
|
Memory usage (GB) |
4.9 |
0.89 |
82% |
|
Average transaction sink flush duration (ms) |
115.0 |
68.00 |
41% |
Prior to optimization, TiCDC couldn’t keep up with upstream writes due to a slow sink. This resulted in continuously increasing checkpoint lag. However, with the new optimization, the CDC checkpoint lag was reduced to 0.52 seconds. CDC memory usage also decreased from 4.9 GB to 0.89 GB. The CDC average transaction sink flush duration also decreased from 115 ms to 68 ms.
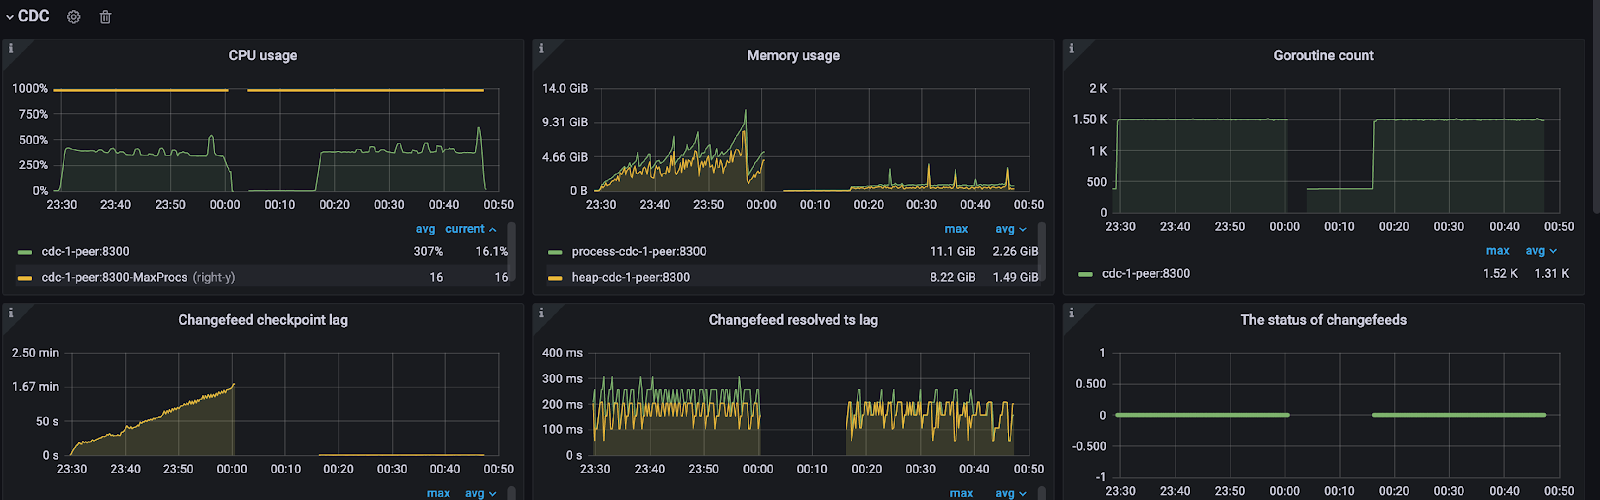
CDC Performance Overview panel, left: v6.5.0-baseline, right: v6.5.0-prep-stmt-cache
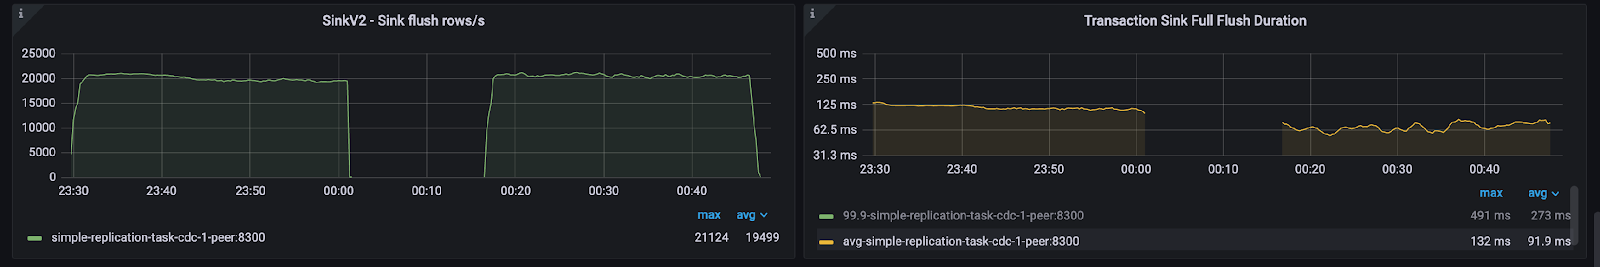
CDC sink performance, left: v6.5.0-baseline, right: v6.5.0-prep-stmt-cache
The new statement caching feature also significantly improves downstream TiDB cluster performance. The plan cache hit rate increased from 0% to 100%, while the average query duration was reduced from 740 ms to 640 ms. Furthermore, the TiDB instance CPU usage decreased from 1,147% to 960%.
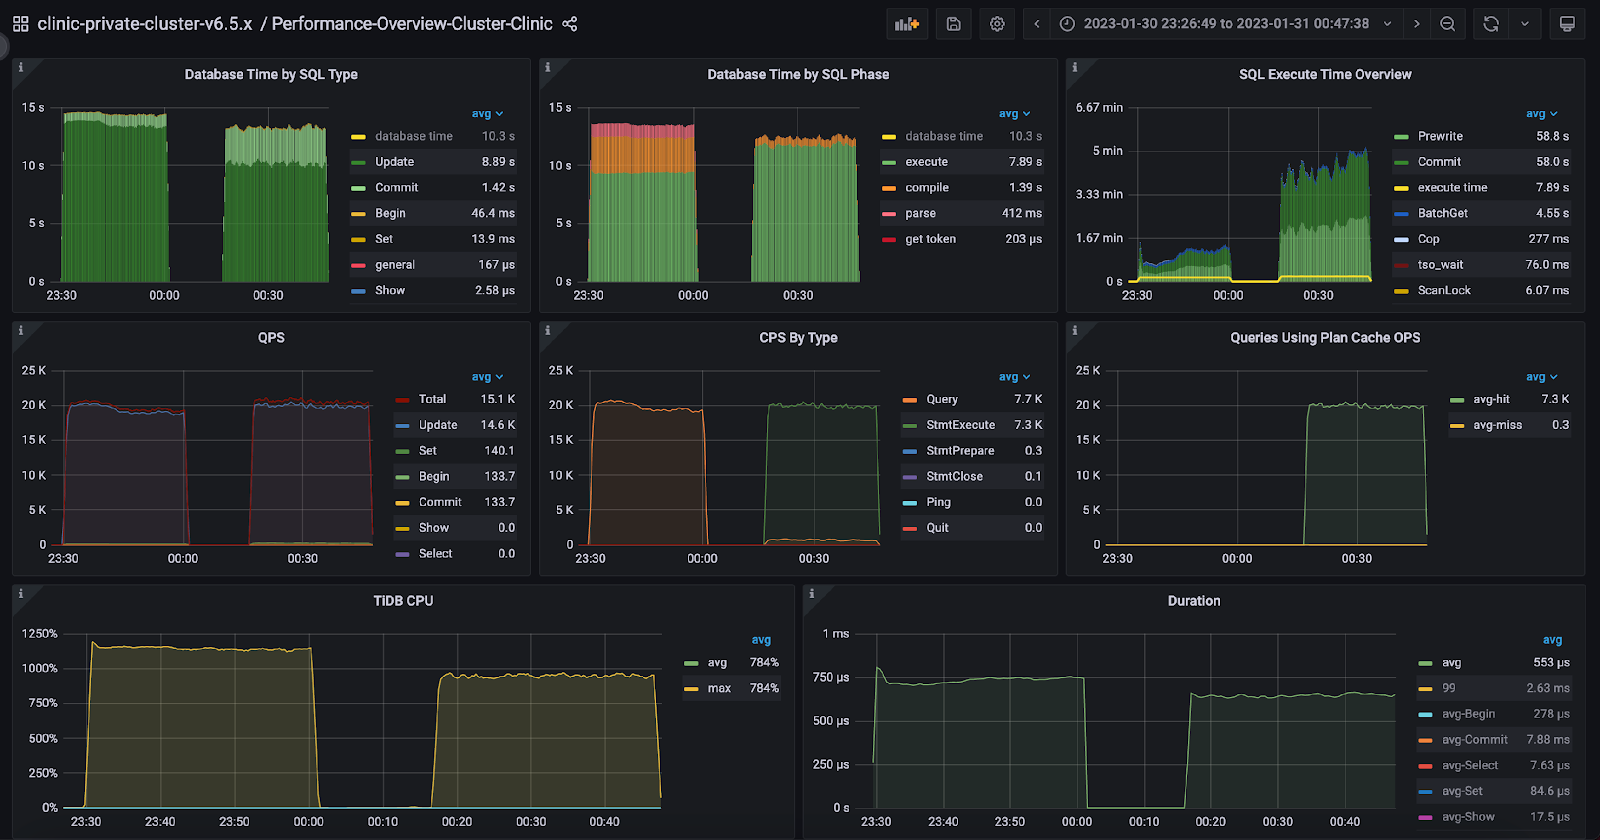
Performance Overview dashboard for downstream TiDB cluster,
left: v6.5.0-baseline, right: v6.5.0-prep-stmt-cache
Conclusion
The implementation of the TiCDC performance feature using ChatGPT has significantly improved TiCDC’s performance and efficiency. With the new statement cache feature, TiCDC can now keep up with upstream writes, dramatically reducing checkpoint lag and significantly decreasing memory usage. The average transaction sink flush duration has also been reduced, leading to faster processing times and more efficient resource utilization.
Thanks to ChatGPT’s AI capabilities, I was able to quickly gain the knowledge and skills necessary to implement this critical performance feature—even without prior development experience. This demonstrates the potential of natural language processing technology to facilitate more effective and efficient software development.
Join our community on Slack and the TiDB Forum to share your thoughts and feedback.
TiCDC is a change data capture (CDC) solution that replicates incremental data changes in real time for TiDB, a distributed SQL database. Previously, TiCDC faced a challenge in its communication with downstream TiDB clusters using query commands, which led to higher CPU usage on SQL parsing and compiling. This issue was particularly significant in larger distributed database systems, where the increased workload could reduce performance and slow down data replication times. Moreover, the lack of plan cache hits further exacerbated the problem, resulting in even slower performance.
Thanks to ChatGPT, a natural language processing and artificial intelligence tool from OpenAI, I was able to resolve these issues. I implemented a TiCDC performance feature that improves the communication between TiCDC and downstream TiDB clusters.
What Do We Need From the TiCDC Performance Feature?
The TiCDC performance feature has clear goals: lower CPU usage on SQL parsing and compiling, and increased plan cache hits, which improves the communication between TiCDC and downstream TiDB clusters. This feature would help optimize TiCDC performance and ensure faster and more reliable data replication across multiple TiDB clusters.
Seeking Help from ChatGPT
My role at PingCAP is QA engineer. Due to limited development resources, I took on the development work, despite not being a full-time developer. This presented additional challenges as I lacked the experience and knowledge to design and implement such a feature.
On the other hand, I recognized how important this feature could be to TiCDC’s performance and reliability, so I was eager to take on the challenge. To bridge my knowledge gap, I turned to ChatGPT, which proved to be an invaluable resource. By leveraging the power of ChatGPT’s natural language processing capabilities, I quickly gained an understanding of the requirements and challenges involved in developing the performance feature. This allowed me to work more effectively with other team members and stakeholders and ultimately deliver a high-quality performance feature that met the needs of the TiCDC project.
Initial Results and Challenges
The module communicating with the downstream database in TiCDC is MySQL sinker. After reviewing TiCDC’s code, I was able to identify the main logic of MySQL sinker in the `execDMLWithMaxRetries` function. I shared the code in mysql.go with ChatGPT, and asked it to rewrite the code to implement a statement cache.
ChatGPT provided a helpful starting point for my analysis, and I was able to gain a deeper understanding of the function’s purpose and logic.
ChatGPT’s initial code prompt
It even reminded me to properly initiate and release the cache map. Nice!
|
Go // release the map in close Interface |
Making the Code Work
MySQL sinker initializes a connection pool to communicate with downstream databases when started. The size of the connection pool is determined by the worker count configuration. The connection pool is created by a DB type defined in the Golang sql package. To ensure transactional semantics when syncing data changes to a downstream database, MySQL sinker uses a database transaction type called Tx.
In the first response of ChatGPT, the cache statements are created by DB.Prepare. However, cache statements created by DB.Prepare cannot be executed directly by the Tx type. After reviewing the Golang sql package, I discovered that I could use the Tx.Stmt function to return a transaction-specific prepared statement from an existing statement. Then I told ChatGPT about the Tx.Stmt function. It provided the following example:
ChatGPT ‘s proposed code sample to integrate with tx.Stmt
After I put the code together, the initial testing showed that the new code used a prepared statement interface as expected. You can see the code here.
A Happy Initial Result With 100% Plan Cache Hit
I used Sysbench, a popular open-source software tool to benchmark MySQL-compatible databases to compare the baseline and the new code.
The performance overview dashboard shown below illustrates the impact of the new implementation on TiCDC’s downstream communication with TiDB. The updated code, shown on the right side of the dashboard, uses the StmtExecute command and has resulted in a plan cache hit rate of 100%. In contrast, the baseline implementation on the left side only uses the query command, resulting in zero plan cache hits.
These performance metrics demonstrate the effectiveness of the updated implementation. It not only improves plan cache hit rates but also optimizes downstream communication between TiCDC and TiDB.
The Performance Overview dashboard for the downstream TiDB cluster
Performance Degradation of the First Version
The chart below illustrates the performance metrics of TiCDC’s baseline implementation (left side) and the updated code (right side). Contrary to expectations, the new code has degraded performance. Queries per Second (QPS) have decreased, and query duration has increased.
Query duration for downstream TiDB Cluster
The new code cached the prepared statements as expected, but the total number of prepared statements per TiDB instance was more than a 1 million. This results in high CPU usage and approximately 27 GB of memory usage.
TiDB dashboard for downstream TiDB clusters
The TiDB heap profile chart also revealed that the cached prepared statements used most of the memory.
TiDB heap profile
The TiDB CPU profile indicates the significant CPU usage on the memory tracker and Golang runtime, due to high memory pressure.
TiDB CPU profile
Solving the Performance Issue
Analyzing the Root Cause
In this particular scenario, the number of worker count is 128. MySQL sink initializes the size of the connection pool accordingly, so there are 128 connections. With 32 tables in the sysbench workload. For each Sysbench table, there are three types of update statements, each statement is cached across all the connections. This leads to an estimated total of 1,572,864 (128*128*32*3) prepared statements. As a result, the memory usage on each TiDB instance is approximately 27 GB.
The code snippet below illustrates how the statement cache is initialized for each worker.
|
Go |
Fixing Performance Degradation
By using a single global statement cache and implementing sync.Mutex, I was able to resolve the performance degradation issue. sync.Mutex is a synchronization primitive in Go. It is used to implement mutual exclusion locks and protect the global statement cache from concurrent access. These changes significantly improved performance, with a 4x increase in QPS and a reduction in average latency from 7.5 ms to 1 ms.
Moreover, the total number of prepared statements for each TiDB instance was reduced from 1.5 million to 12,000, which considerably reduced memory usage from approximately 27 GB to 3.5 GB.
The code snippet below illustrates how to deploy a single global statement cache for all the workers. Please check the pull request for more full code.
|
Go backends := make([]*mysqlBackend, 0, cfg.WorkerCount) |
QPS and latency difference
TiDB CPU/memory usage
Benchmarking the Implementation
When benchmarked using the sysbench workload involving 32 tables, the new statement cache feature resulted in significant improvements over the baseline implementation.
|
Metric |
v6.5.0-baseline |
v6.5.0-prep-stmt-cache |
Improvement |
|
Checkpoint lag (s) |
>10.0 |
0.52 |
95% |
|
Memory usage (GB) |
4.9 |
0.89 |
82% |
|
Average transaction sink flush duration (ms) |
115.0 |
68.00 |
41% |
Prior to optimization, TiCDC couldn’t keep up with upstream writes due to a slow sink. This resulted in continuously increasing checkpoint lag. However, with the new optimization, the CDC checkpoint lag was reduced to 0.52 seconds. CDC memory usage also decreased from 4.9 GB to 0.89 GB. The CDC average transaction sink flush duration also decreased from 115 ms to 68 ms.
CDC Performance Overview panel, left: v6.5.0-baseline, right: v6.5.0-prep-stmt-cache
CDC sink performance, left: v6.5.0-baseline, right: v6.5.0-prep-stmt-cache
The new statement caching feature also significantly improves downstream TiDB cluster performance. The plan cache hit rate increased from 0% to 100%, while the average query duration was reduced from 740 ms to 640 ms. Furthermore, the TiDB instance CPU usage decreased from 1,147% to 960%.
Performance Overview dashboard for downstream TiDB cluster,
left: v6.5.0-baseline, right: v6.5.0-prep-stmt-cache
Conclusion
The implementation of the TiCDC performance feature using ChatGPT has significantly improved TiCDC’s performance and efficiency. With the new statement cache feature, TiCDC can now keep up with upstream writes, dramatically reducing checkpoint lag and significantly decreasing memory usage. The average transaction sink flush duration has also been reduced, leading to faster processing times and more efficient resource utilization.
Thanks to ChatGPT’s AI capabilities, I was able to quickly gain the knowledge and skills necessary to implement this critical performance feature—even without prior development experience. This demonstrates the potential of natural language processing technology to facilitate more effective and efficient software development.
Join our community on Slack and the TiDB Forum to share your thoughts and feedback.
Denial of responsibility! Techno Blender is an automatic aggregator of the all world’s media. In each content, the hyperlink to the primary source is specified. All trademarks belong to their rightful owners, all materials to their authors. If you are the owner of the content and do not want us to publish your materials, please contact us by email – [email protected]. The content will be deleted within 24 hours.