
Invisible Numbers Are the Most Beautiful Part of Every ‘Space’ Image
Each year, millions of people visit the Louvre in Paris to gaze upon arguably the most iconic work of art in history: Leonardo da Vinci’s Mona Lisa. Most visitors are drawn to the painting’s aura of mystery. But some behold a deeper beauty there, too—the Mona Lisa’s hazy landscape and beguiling expression alike arise from Leonardo’s use of sfumato, a complex technique in which soft outlines emerge from many delicate layers of paint, like figures from a fog. Some of the Mona Lisa’s layers, scientists showed in 2010, are 10 times thinner than a typical human hair.
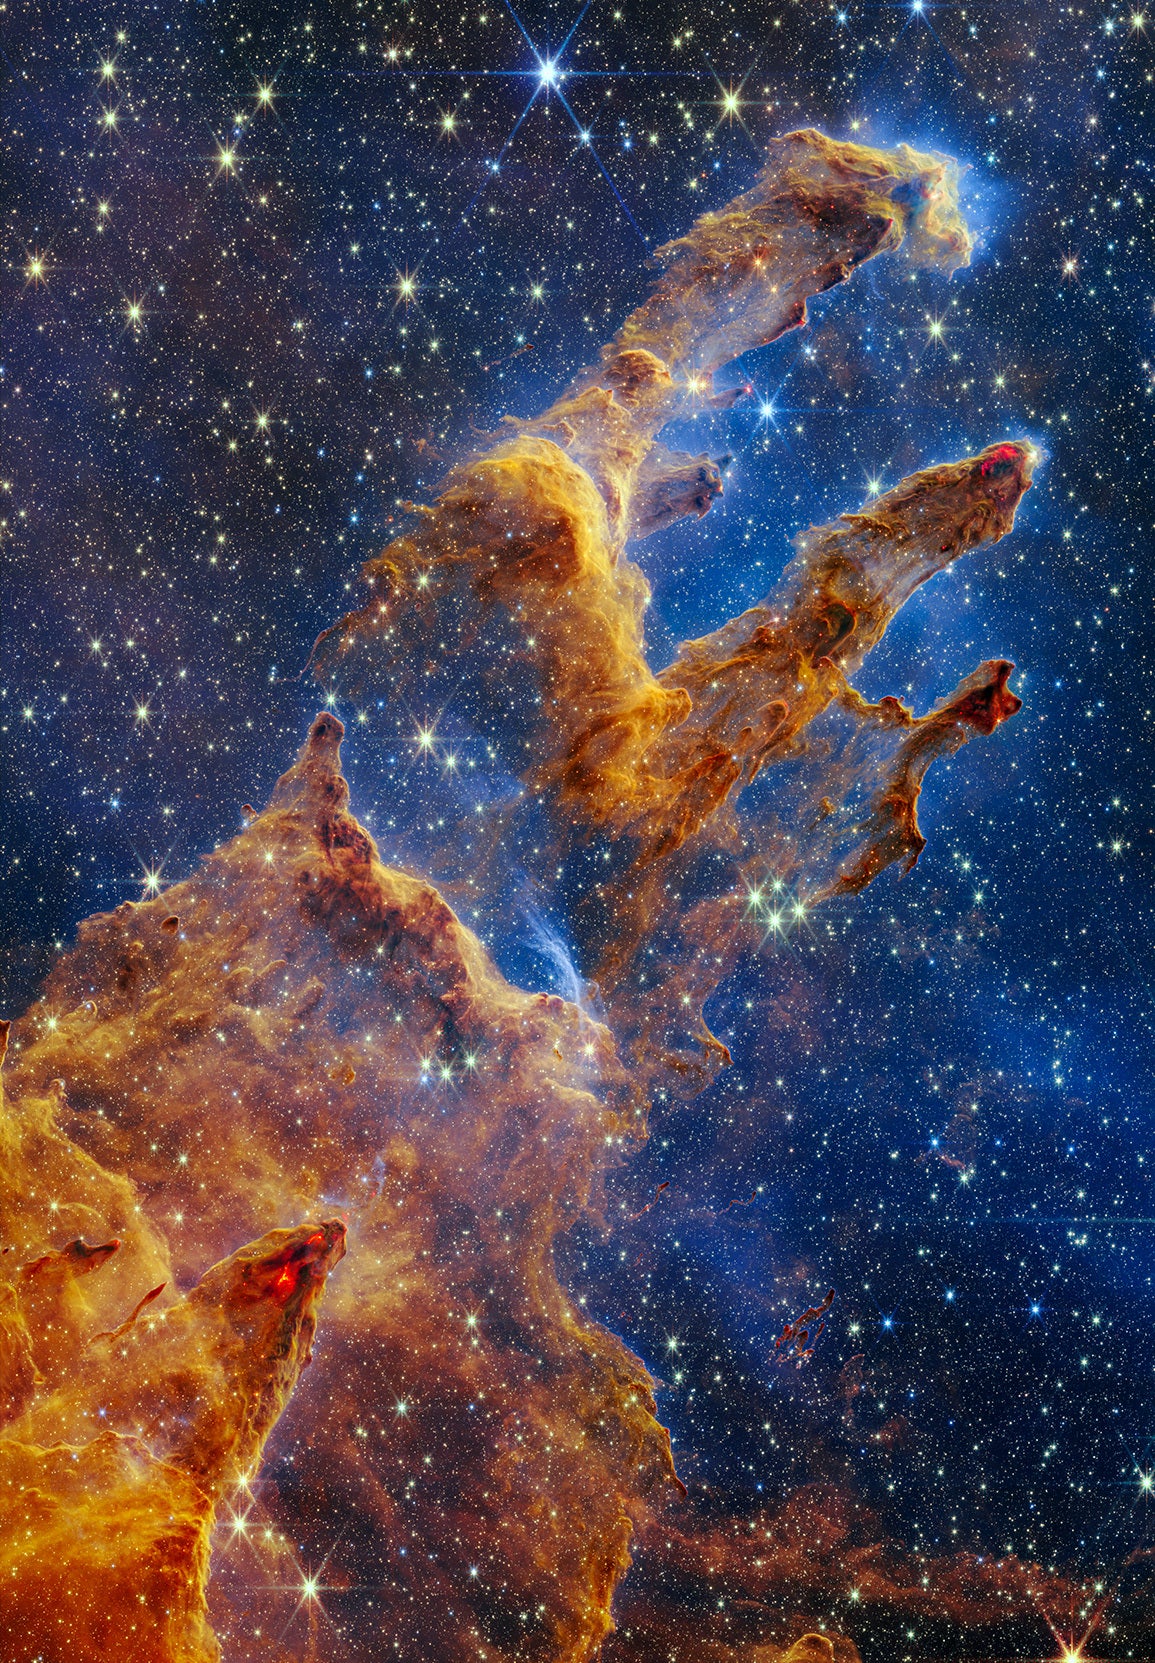
Humans, in general, are hardwired to react to their primary senses—among which, vision is often considered the most powerful. Of course, this is the fundamental reason why a single image, like the Mona Lisa, can be so visceral, so filled with emotional power. In astronomy, iconic images, like the “pillars of creation” or a black hole’s event horizon, are beautiful and awe-inspiring, but what we see is essentially made of numbers rather than imperceptibly sheer sheens of paint. The “visual” parts of these heavenly vistas usually represent only a vanishing fraction of the beautiful data that astronomers use to study the sky, and it is the infinitudes of numerical data that teach us about the universe.
For example, consider a recent study revealing that a nearby sunlike star is orbiting a small black hole. The pair is locked in a twirling dance only 1,565 light-years away, meaning that the star emitted the light we now observe just before the fall of the Roman Empire. This discovery breaks the record for the closest black hole ever found and suggests a sizable population of similar dark objects lurking within the Milky Way. Yet no one has directly viewed this black hole, which is invisible to our telescopes and eyes alike. It will forever be an unseen companion wobbling the orbit of its partner star. Astronomers detected these ghostly pirouettes by analyzing exquisitely precise data from the Gaia satellite, revealing the partner star’s periodic motion. Unlike the James Webb and Hubble space telescopes, each outfitted with multiple sophisticated cameras to yield gorgeous images of celestial pyrotechnics, Gaia primarily produces pure numerical data. Yet from those silent, invisible numbers, astronomers still make beautiful, world-changing discoveries using mathematical models to describe reality.
This fact does not only pertain to the modern world. In 1846, Johann Gottfried Galle discovered Neptune, our solar system’s eighth planet, based on predictions made the previous year by the French astronomer Urbain Le Verrier. Le Verrier had noted that the orbit of Uranus, the then-farthest planet, was strangely perturbed by a mysterious mass, and then through excruciating numerical calculations had pinpointed the unseen perturber’s orbit and where the body should appear in the sky. When Galle pointed his telescope there, he observed Neptune as a tremulous dot moving against the background stars. Suddenly, the solar system had gained a whole new world.
And yet, then and now, images remain the dominant form for publicizing scientific discovery—even outside of astronomy. In the church of science, data may be sacrosanct, but images are the true disciples, because seeing is believing. This fact is evident by comparing two recent and groundbreaking discoveries: the first detection of gravitational waves, announced in February 2016, and the first image of the event horizon of a black hole, in April 2019. The two breakthroughs occurred at comparable times and were both revolutionary. The former produced mostly numerical data and was soon awarded a Nobel Prize, while the latter made an “image” among many other data. Unsurprisingly, the image of the black hole generated almost seven times more Internet traffic than the detection of gravitational waves—even after accounting for a higher background of Internet searches for black holes instead of gravitational waves.
What is so special about astronomical images? The public and scientists have, of course, different approaches and goals. For astronomers, any and all pictures are also numerical data; for example, a star may manifest as just a bunch of pixels on a telescope’s camera, but even that solitary dot can reveal the star’s intrinsic luminosity and its temperature. A sprawling multigigapixel panorama of a majestic galaxy, such as the one in the constellation of Andromeda, can, of course, inspire contemplative awe about our place in the universe. But in addition to all that, astronomers can also use such images to measure a galaxy’s fundamental properties, such as its size, and even more subtle things like its spin or the types and distribution of its stars.
Ultimately, both visual and nonvisual data describe the reality of our world. The difference is that nonvisual data requires an interface, a mathematical model, to narrate reality. The data representing the waltz of a star and black hole would be meaningless if not backed by a theory of gravitation. The precise interferometric data that led to the detection of gravitational waves would be unintelligible if not based on Einstein’s general theory of relativity.
In his influential essay “What Is It Like to Be a Bat?,” the American philosopher Thomas Nagel argues that “Lightning has an objective character that is not exhausted by its visual appearance, and this can be investigated by a Martian without vision. To be precise, it has a more objective character than is revealed in its visual appearance.” (Emphasis in original.) The appearance of lightning and a mathematical model of the electromagnetic field’s variation describe the same reality.
Scientists are trained to understand reality through the interface of models. To an astronomer, a graph with a meandering curve that constitutes proof of a gravitational wave rippling through a detector can be as exciting as seeing a movie visualizing the merger of two black holes.
This fact extends the discussion to another level: what is the role of astronomers in communicating with the public? Ultimately, it is to display and express the beauty of our universe by making it understandable to everyone. This enterprise sometimes requires explaining the intricacies of scientific studies, which often go well beyond magnificent images. Just as a clock is effective in measuring time because of the intricacies of its clockwork, the full beauty of a space photo rests upon complex mathematics. The numbers that these images hide have a charm all their own.
This is an opinion and analysis article, and the views expressed by the author or authors are not necessarily those of Scientific American.
Each year, millions of people visit the Louvre in Paris to gaze upon arguably the most iconic work of art in history: Leonardo da Vinci’s Mona Lisa. Most visitors are drawn to the painting’s aura of mystery. But some behold a deeper beauty there, too—the Mona Lisa’s hazy landscape and beguiling expression alike arise from Leonardo’s use of sfumato, a complex technique in which soft outlines emerge from many delicate layers of paint, like figures from a fog. Some of the Mona Lisa’s layers, scientists showed in 2010, are 10 times thinner than a typical human hair.
Humans, in general, are hardwired to react to their primary senses—among which, vision is often considered the most powerful. Of course, this is the fundamental reason why a single image, like the Mona Lisa, can be so visceral, so filled with emotional power. In astronomy, iconic images, like the “pillars of creation” or a black hole’s event horizon, are beautiful and awe-inspiring, but what we see is essentially made of numbers rather than imperceptibly sheer sheens of paint. The “visual” parts of these heavenly vistas usually represent only a vanishing fraction of the beautiful data that astronomers use to study the sky, and it is the infinitudes of numerical data that teach us about the universe.
For example, consider a recent study revealing that a nearby sunlike star is orbiting a small black hole. The pair is locked in a twirling dance only 1,565 light-years away, meaning that the star emitted the light we now observe just before the fall of the Roman Empire. This discovery breaks the record for the closest black hole ever found and suggests a sizable population of similar dark objects lurking within the Milky Way. Yet no one has directly viewed this black hole, which is invisible to our telescopes and eyes alike. It will forever be an unseen companion wobbling the orbit of its partner star. Astronomers detected these ghostly pirouettes by analyzing exquisitely precise data from the Gaia satellite, revealing the partner star’s periodic motion. Unlike the James Webb and Hubble space telescopes, each outfitted with multiple sophisticated cameras to yield gorgeous images of celestial pyrotechnics, Gaia primarily produces pure numerical data. Yet from those silent, invisible numbers, astronomers still make beautiful, world-changing discoveries using mathematical models to describe reality.
This fact does not only pertain to the modern world. In 1846, Johann Gottfried Galle discovered Neptune, our solar system’s eighth planet, based on predictions made the previous year by the French astronomer Urbain Le Verrier. Le Verrier had noted that the orbit of Uranus, the then-farthest planet, was strangely perturbed by a mysterious mass, and then through excruciating numerical calculations had pinpointed the unseen perturber’s orbit and where the body should appear in the sky. When Galle pointed his telescope there, he observed Neptune as a tremulous dot moving against the background stars. Suddenly, the solar system had gained a whole new world.
And yet, then and now, images remain the dominant form for publicizing scientific discovery—even outside of astronomy. In the church of science, data may be sacrosanct, but images are the true disciples, because seeing is believing. This fact is evident by comparing two recent and groundbreaking discoveries: the first detection of gravitational waves, announced in February 2016, and the first image of the event horizon of a black hole, in April 2019. The two breakthroughs occurred at comparable times and were both revolutionary. The former produced mostly numerical data and was soon awarded a Nobel Prize, while the latter made an “image” among many other data. Unsurprisingly, the image of the black hole generated almost seven times more Internet traffic than the detection of gravitational waves—even after accounting for a higher background of Internet searches for black holes instead of gravitational waves.
What is so special about astronomical images? The public and scientists have, of course, different approaches and goals. For astronomers, any and all pictures are also numerical data; for example, a star may manifest as just a bunch of pixels on a telescope’s camera, but even that solitary dot can reveal the star’s intrinsic luminosity and its temperature. A sprawling multigigapixel panorama of a majestic galaxy, such as the one in the constellation of Andromeda, can, of course, inspire contemplative awe about our place in the universe. But in addition to all that, astronomers can also use such images to measure a galaxy’s fundamental properties, such as its size, and even more subtle things like its spin or the types and distribution of its stars.
Ultimately, both visual and nonvisual data describe the reality of our world. The difference is that nonvisual data requires an interface, a mathematical model, to narrate reality. The data representing the waltz of a star and black hole would be meaningless if not backed by a theory of gravitation. The precise interferometric data that led to the detection of gravitational waves would be unintelligible if not based on Einstein’s general theory of relativity.
In his influential essay “What Is It Like to Be a Bat?,” the American philosopher Thomas Nagel argues that “Lightning has an objective character that is not exhausted by its visual appearance, and this can be investigated by a Martian without vision. To be precise, it has a more objective character than is revealed in its visual appearance.” (Emphasis in original.) The appearance of lightning and a mathematical model of the electromagnetic field’s variation describe the same reality.
Scientists are trained to understand reality through the interface of models. To an astronomer, a graph with a meandering curve that constitutes proof of a gravitational wave rippling through a detector can be as exciting as seeing a movie visualizing the merger of two black holes.
This fact extends the discussion to another level: what is the role of astronomers in communicating with the public? Ultimately, it is to display and express the beauty of our universe by making it understandable to everyone. This enterprise sometimes requires explaining the intricacies of scientific studies, which often go well beyond magnificent images. Just as a clock is effective in measuring time because of the intricacies of its clockwork, the full beauty of a space photo rests upon complex mathematics. The numbers that these images hide have a charm all their own.
This is an opinion and analysis article, and the views expressed by the author or authors are not necessarily those of Scientific American.
Denial of responsibility! Techno Blender is an automatic aggregator of the all world’s media. In each content, the hyperlink to the primary source is specified. All trademarks belong to their rightful owners, all materials to their authors. If you are the owner of the content and do not want us to publish your materials, please contact us by email – [email protected]. The content will be deleted within 24 hours.