
Key Learning Points from MLOps Specialization — Course 4 | by Kenneth Leung | May, 2022
MLOPS SPECIALIZATION SERIES
Final insights (with lecture notes) from the Machine Learning Engineering for Production (MLOps) Course by DeepLearning.AI & Andrew Ng
Realizing the potential of machine learning (ML) in the real world goes beyond model training. By leveraging the best practices of MLOps, teams can better operationalize and manage the end-to-end lifecycles of ML models in a sustainable manner.
In this final article of the 4-part MLOps Specialization series, I summarize the lessons of Course 4 so that you can skip the hours of online videos while still gleaning the key insights.
Contents
(1) Overview
(2) Key Lessons
(3) Lecture Notes
This article covers Course 4 of the 4-course MLOps specialization. Follow this page to stay updated with more ML content.
The final course of the MLOps specialization focuses on deploying trained ML models and making them available to end-users.
We look at building reliable infrastructure and delivering production systems progressively for real-time or batch inference.
Furthermore, we explore how to monitor these systems to detect model decay, remediate performance drops, and avoid system failures.
PART 1 — Model Serving Introduction
Real-time and Batch Inference
- Model serving refers to making the trained models available for end-users to utilize.
- There are two main ways to obtain model predictions (aka inference) — Real-time inference and batch inference.
- In batch inference, the deployed ML model makes predictions based on historical input data. This scenario is often sufficient when it is not critical to obtain real-time predictions.
- Real-time predictions, a.k.a on-demand or online inference, are predictions generated in real-time using the input data available at the time of inference.
Optimizing Real-time inference
- As part of optimizing real-time inference, there are three key metrics: Latency, Cost, and Throughput.

- Latency is the delay between a user’s action and the application’s response to the action.
- Cost refers to the infrastructure costs associated with inference (e.g., CPU, GPU, Caching)
- Throughput is the number of successful requests served in a unit of time.
- Many customer-facing applications aim to minimize latency while maximizing throughput, e.g., airline recommendations websites.
- Ultimately, it is a balancing act in ensuring high system performance while keeping costs within reasonable limits.
Balancing Complexity and Cost
- When building and selecting our model, there are two types of metrics to evaluate to balance performance and cost: optimizing and gating metrics.

- Optimizing metrics include measures like accuracy and precision, which reflect the model’s predictive capabilities.
- We often get caught up with increasing model complexity to boost performance, so we need to be mindful of the costs since higher complexity leads to higher costs.
- Hence, gating metrics such as GPU load and model size serve as operational constraints for our model to operate within cost and hardware limits.
Deployment Options
- There are primarily two choices regarding where to deploy the model — data center or on-device (e.g., mobile phones, embedded devices).

- It means we can either deploy the model in a data center server accessed via a remote API call or distribute instances of the model directly to the user’s devices.
Constraints with Embedded Devices
- Distributed environments like mobile phones and embedded devices have certain constraints such as memory, storage, and battery capacities.
- For example, a phone’s average GPU memory is less than ~4GB, and applications besides your ML model share this GPU.
- Such constrained environments mean that we do not deploy large complex models into these devices.
- These constraints also mean that we must choose the best model for the specific task. For instance, MobileNets is specifically designed for computer vision on mobile devices.
PART 2 — Patterns and Infrastructure
Model Servers
- Model servers allow us to deploy ML models at scale so that we can retrieve model predictions via API calls readily.
- We can host these model servers on-premise or on-cloud.

- The model server works by first instantiating the ML model based on model artifacts. The prediction function of the model is then exposed to clients via REST (or gRPC) API endpoints.
- TensorFlow Serving is an example of an open-source model server that offers a flexible, high-performance ML serving system designed for production environments.
- Other popular model servers include NVIDIA Triton Inference Server, Kubeflow Serving, and TorchServe.
Importance of Scaling
- Vast volumes of inference requests can overwhelm the model servers. Model infrastructure must thus be able to scale up and down readily to handle different request sizes.
- There are two main ways to scale: Horizontal and Vertical
- Vertical scaling refers to using bigger and more powerful hardware, e.g., upgrading the CPU, adding more RAM, using newer GPUs, etc.
- Horizontal scaling refers to adding more nodes/devices (i.e., CPUs, GPUs) to meet the demands of increased inference load.
- Horizontal scaling is generally recommended for several reasons:
- Allows for elasticity as it is easier to adjust the number of nodes based on load, throughput, and latency requirements
- No need to take existing servers offline for hardware upgrades
- No limit on hardware capacity since nodes can be added at any time
Containerization
- ML applications are typically associated with many dependencies and configurable items.
- Containers make it easy to package and run the entire ML application in a lightweight manner without worrying about operating system (OS) requirements.
- Containers allow for ML applications’ fast and agile deployment coupled with easy horizontal scalability.
- Docker is the most popular open-source platform for building, deploying, and managing containerized applications.

- We can use container orchestration software like Kubernetes and Docker Swarm to manage and sync multiple containers across multiple machines.
PART 3 — Model Management and Delivery
Experiment Tracking
- Experiments are fundamental to ML model development, and tracking the results is critical to debugging and improving model performance.
- The tracking aspects include the code, hyperparameters, execution environment, library versions, and model performance metrics.
- Jupyter notebooks are great for running and tracking simple experiments, but this is not the best way forward since notebooks are usually not promoted to production.
- Experiment tracking can be done with tools like TensorBoard, Weights and Biases, and Neptune.
- A good habit is to include consistent and meaningful tags for each experiment so that results are organized and easy to interpret.
Data Versioning
- Data only reflects a snapshot of the world when the data was gathered, and data is expected to change over time.
- It is vital to version our data along with the code and runtime parameters we typically track.
- Some good tools for data versioning include Pachyderm, DVC, and ML Metadata (MLMD).
Model Versioning and Registry
- As each model may have different code, data, and configuration, it is important to perform model versioning.
- With model versioning, we can readily retrieve older models and understand model lineage (i.e., the set of relationships among artifacts that resulted in the model).
- A model registry is a central repository for storing trained models, and it provides an API for managing and searching for trained models.
- Model registries are essential in supporting model discovery, model understanding, and model reuse, including in large-scale environments with hundreds of models.

Need for MLOps
- Numerous problems affecting ML efforts today mirror what the software engineering field faced in the recent past.
- The problems include lack of reproducibility and provenance, inefficient collaboration, manual tracking, slow-to-market efforts, and models blocked before deployment.
- MLOps borrows concepts from DevOps to standardize and unify ML system development lifecycles to tackle the challenges above.
- The objective of MLOps is to create a consistent and reliable means to automate the training and deployment of models coupled with robust and comprehensive monitoring.
MLOps Maturity — Level 0
- The maturity of an MLOps system is determined by the level of automation of the data, modeling, deployment, and maintenance.
- MLOps Level 0 is the basic level where ML lifecycle processes are manual.
- It is concerned only with deploying the trained model as a prediction service. It does not involve processes for automatic retraining or active performance monitoring.
- This level of maturity is typical in many businesses that are starting to adopt ML in their use cases.
MLOps Maturity — Level 1
- MLOps Level 1 introduces pipeline automation with the goal of automated continuous model training.
- It includes vital components such as automated data and model validation, pipeline triggers, and metadata management.
MLOps Maturity — Level 2
- MLOps Level 2 is still somewhat speculative currently.
- It involves robust automated continuous integration/continuous delivery (CI/CD) so that teams can rapidly explore new ideas around feature engineering, model architecture, and hyperparameters.
- This level of maturity also involves key components such as source code control, deployment services, model registry, and feature stores.
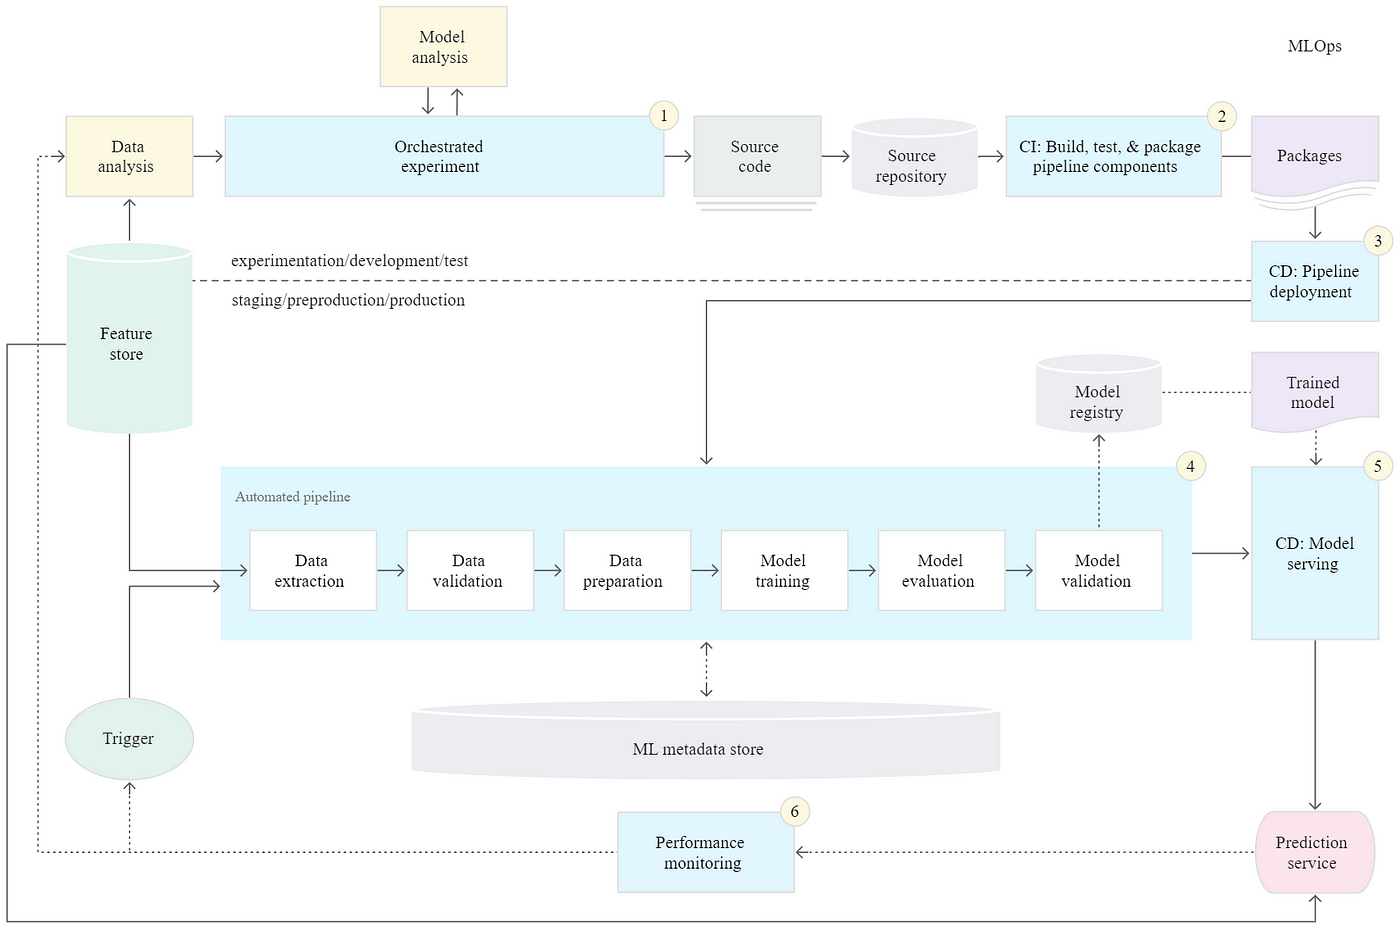
Continuous Integration/Continuous Delivery (CI/CD)
- Comprehensive integration (CI) involves the building, packaging, and testing of new code when it is committed to the source code repository.
- Unit testing is crucial to check that the code works correctly before deployment as part of CI and involves mocking, data coverage, and code coverage.

- Continuous Delivery (CD) is the process of deploying the system of new code and newly trained models into the target environment while ensuring compatibility and prediction service performance.
- The entire process and infrastructure of continuous integration and continuous delivery are referred to as CI/CD.
Progressive Delivery
- Progressive delivery is deemed as a development process that is an improvement over CI/CD.
- It focuses on gradually rolling out new features to limit potential deployment risks and increase the speed of deployment.
- It involves delivering changes first to small, low-risk audiences and then expanding to larger and riskier audiences.
- Examples of progressive delivery include blue/green deployment, canary deployment, and live experimentation.
PART 4 — Model Monitoring and Logging
Why Monitoring Matters
- ML development is a cyclical iterative process, and monitoring is vital for improving and sustaining the ML system.
- Continuous monitoring is important in identifying data skews, model staleness, and negative feedback loops.
Monitoring in ML Systems
- ML monitoring is different from software monitoring because ML systems have two additional components: the data and the model.
- ML system monitoring comprises two key components — functional monitoring and system monitoring.
- Functional monitoring keeps an eye on model predictive performance and changes in serving data. These include model performance metrics and the distributions and characteristics of each feature in the data.
- System monitoring refers to monitoring the production system’s performance and the serving system’s reliability. It includes operational metrics like throughput, latency, resource utilization, etc.

Logging
- Logging is an important way to build observability around models and systems.
- A log is an immutable time-stamped record of discrete events (e.g., model inputs, predictions) in the ML system.
- Using aggregate sinks and workspaces allows teams to centralize logs to create a unified view of the ML system for reporting and alerting.
- While logging is undeniably useful, there are certain disadvantages we have to be aware of.
- Excessive logging can impact system performance, and there are significant costs with aggregation operations on logs as well as setting up and maintaining logging tools.
As a token of appreciation, here’s the GitHub repo with the PDF lecture notes compiled from the slides and transcripts. There are plenty of other valuable insights in these notes, so check them out!
You can find the summaries of the previous three courses here:
I welcome you to join me on a data science learning journey! Follow this Medium page and check out my GitHub to stay in the loop of more exciting data science content. Meanwhile, have fun building production ML systems!
MLOPS SPECIALIZATION SERIES
Final insights (with lecture notes) from the Machine Learning Engineering for Production (MLOps) Course by DeepLearning.AI & Andrew Ng

Realizing the potential of machine learning (ML) in the real world goes beyond model training. By leveraging the best practices of MLOps, teams can better operationalize and manage the end-to-end lifecycles of ML models in a sustainable manner.
In this final article of the 4-part MLOps Specialization series, I summarize the lessons of Course 4 so that you can skip the hours of online videos while still gleaning the key insights.
Contents
(1) Overview
(2) Key Lessons
(3) Lecture Notes
This article covers Course 4 of the 4-course MLOps specialization. Follow this page to stay updated with more ML content.
The final course of the MLOps specialization focuses on deploying trained ML models and making them available to end-users.
We look at building reliable infrastructure and delivering production systems progressively for real-time or batch inference.
Furthermore, we explore how to monitor these systems to detect model decay, remediate performance drops, and avoid system failures.
PART 1 — Model Serving Introduction
Real-time and Batch Inference
- Model serving refers to making the trained models available for end-users to utilize.
- There are two main ways to obtain model predictions (aka inference) — Real-time inference and batch inference.
- In batch inference, the deployed ML model makes predictions based on historical input data. This scenario is often sufficient when it is not critical to obtain real-time predictions.
- Real-time predictions, a.k.a on-demand or online inference, are predictions generated in real-time using the input data available at the time of inference.
Optimizing Real-time inference
- As part of optimizing real-time inference, there are three key metrics: Latency, Cost, and Throughput.
- Latency is the delay between a user’s action and the application’s response to the action.
- Cost refers to the infrastructure costs associated with inference (e.g., CPU, GPU, Caching)
- Throughput is the number of successful requests served in a unit of time.
- Many customer-facing applications aim to minimize latency while maximizing throughput, e.g., airline recommendations websites.
- Ultimately, it is a balancing act in ensuring high system performance while keeping costs within reasonable limits.
Balancing Complexity and Cost
- When building and selecting our model, there are two types of metrics to evaluate to balance performance and cost: optimizing and gating metrics.
- Optimizing metrics include measures like accuracy and precision, which reflect the model’s predictive capabilities.
- We often get caught up with increasing model complexity to boost performance, so we need to be mindful of the costs since higher complexity leads to higher costs.
- Hence, gating metrics such as GPU load and model size serve as operational constraints for our model to operate within cost and hardware limits.
Deployment Options
- There are primarily two choices regarding where to deploy the model — data center or on-device (e.g., mobile phones, embedded devices).
- It means we can either deploy the model in a data center server accessed via a remote API call or distribute instances of the model directly to the user’s devices.
Constraints with Embedded Devices
- Distributed environments like mobile phones and embedded devices have certain constraints such as memory, storage, and battery capacities.
- For example, a phone’s average GPU memory is less than ~4GB, and applications besides your ML model share this GPU.
- Such constrained environments mean that we do not deploy large complex models into these devices.
- These constraints also mean that we must choose the best model for the specific task. For instance, MobileNets is specifically designed for computer vision on mobile devices.
PART 2 — Patterns and Infrastructure
Model Servers
- Model servers allow us to deploy ML models at scale so that we can retrieve model predictions via API calls readily.
- We can host these model servers on-premise or on-cloud.
- The model server works by first instantiating the ML model based on model artifacts. The prediction function of the model is then exposed to clients via REST (or gRPC) API endpoints.
- TensorFlow Serving is an example of an open-source model server that offers a flexible, high-performance ML serving system designed for production environments.
- Other popular model servers include NVIDIA Triton Inference Server, Kubeflow Serving, and TorchServe.
Importance of Scaling
- Vast volumes of inference requests can overwhelm the model servers. Model infrastructure must thus be able to scale up and down readily to handle different request sizes.
- There are two main ways to scale: Horizontal and Vertical
- Vertical scaling refers to using bigger and more powerful hardware, e.g., upgrading the CPU, adding more RAM, using newer GPUs, etc.
- Horizontal scaling refers to adding more nodes/devices (i.e., CPUs, GPUs) to meet the demands of increased inference load.
- Horizontal scaling is generally recommended for several reasons:
- Allows for elasticity as it is easier to adjust the number of nodes based on load, throughput, and latency requirements
- No need to take existing servers offline for hardware upgrades
- No limit on hardware capacity since nodes can be added at any time
Containerization
- ML applications are typically associated with many dependencies and configurable items.
- Containers make it easy to package and run the entire ML application in a lightweight manner without worrying about operating system (OS) requirements.
- Containers allow for ML applications’ fast and agile deployment coupled with easy horizontal scalability.
- Docker is the most popular open-source platform for building, deploying, and managing containerized applications.
- We can use container orchestration software like Kubernetes and Docker Swarm to manage and sync multiple containers across multiple machines.
PART 3 — Model Management and Delivery
Experiment Tracking
- Experiments are fundamental to ML model development, and tracking the results is critical to debugging and improving model performance.
- The tracking aspects include the code, hyperparameters, execution environment, library versions, and model performance metrics.
- Jupyter notebooks are great for running and tracking simple experiments, but this is not the best way forward since notebooks are usually not promoted to production.
- Experiment tracking can be done with tools like TensorBoard, Weights and Biases, and Neptune.
- A good habit is to include consistent and meaningful tags for each experiment so that results are organized and easy to interpret.
Data Versioning
- Data only reflects a snapshot of the world when the data was gathered, and data is expected to change over time.
- It is vital to version our data along with the code and runtime parameters we typically track.
- Some good tools for data versioning include Pachyderm, DVC, and ML Metadata (MLMD).
Model Versioning and Registry
- As each model may have different code, data, and configuration, it is important to perform model versioning.
- With model versioning, we can readily retrieve older models and understand model lineage (i.e., the set of relationships among artifacts that resulted in the model).
- A model registry is a central repository for storing trained models, and it provides an API for managing and searching for trained models.
- Model registries are essential in supporting model discovery, model understanding, and model reuse, including in large-scale environments with hundreds of models.
Need for MLOps
- Numerous problems affecting ML efforts today mirror what the software engineering field faced in the recent past.
- The problems include lack of reproducibility and provenance, inefficient collaboration, manual tracking, slow-to-market efforts, and models blocked before deployment.
- MLOps borrows concepts from DevOps to standardize and unify ML system development lifecycles to tackle the challenges above.
- The objective of MLOps is to create a consistent and reliable means to automate the training and deployment of models coupled with robust and comprehensive monitoring.
MLOps Maturity — Level 0
- The maturity of an MLOps system is determined by the level of automation of the data, modeling, deployment, and maintenance.
- MLOps Level 0 is the basic level where ML lifecycle processes are manual.
- It is concerned only with deploying the trained model as a prediction service. It does not involve processes for automatic retraining or active performance monitoring.
- This level of maturity is typical in many businesses that are starting to adopt ML in their use cases.
MLOps Maturity — Level 1
- MLOps Level 1 introduces pipeline automation with the goal of automated continuous model training.
- It includes vital components such as automated data and model validation, pipeline triggers, and metadata management.
MLOps Maturity — Level 2
- MLOps Level 2 is still somewhat speculative currently.
- It involves robust automated continuous integration/continuous delivery (CI/CD) so that teams can rapidly explore new ideas around feature engineering, model architecture, and hyperparameters.
- This level of maturity also involves key components such as source code control, deployment services, model registry, and feature stores.
Continuous Integration/Continuous Delivery (CI/CD)
- Comprehensive integration (CI) involves the building, packaging, and testing of new code when it is committed to the source code repository.
- Unit testing is crucial to check that the code works correctly before deployment as part of CI and involves mocking, data coverage, and code coverage.
- Continuous Delivery (CD) is the process of deploying the system of new code and newly trained models into the target environment while ensuring compatibility and prediction service performance.
- The entire process and infrastructure of continuous integration and continuous delivery are referred to as CI/CD.
Progressive Delivery
- Progressive delivery is deemed as a development process that is an improvement over CI/CD.
- It focuses on gradually rolling out new features to limit potential deployment risks and increase the speed of deployment.
- It involves delivering changes first to small, low-risk audiences and then expanding to larger and riskier audiences.
- Examples of progressive delivery include blue/green deployment, canary deployment, and live experimentation.
PART 4 — Model Monitoring and Logging
Why Monitoring Matters
- ML development is a cyclical iterative process, and monitoring is vital for improving and sustaining the ML system.
- Continuous monitoring is important in identifying data skews, model staleness, and negative feedback loops.
Monitoring in ML Systems
- ML monitoring is different from software monitoring because ML systems have two additional components: the data and the model.
- ML system monitoring comprises two key components — functional monitoring and system monitoring.
- Functional monitoring keeps an eye on model predictive performance and changes in serving data. These include model performance metrics and the distributions and characteristics of each feature in the data.
- System monitoring refers to monitoring the production system’s performance and the serving system’s reliability. It includes operational metrics like throughput, latency, resource utilization, etc.
Logging
- Logging is an important way to build observability around models and systems.
- A log is an immutable time-stamped record of discrete events (e.g., model inputs, predictions) in the ML system.
- Using aggregate sinks and workspaces allows teams to centralize logs to create a unified view of the ML system for reporting and alerting.
- While logging is undeniably useful, there are certain disadvantages we have to be aware of.
- Excessive logging can impact system performance, and there are significant costs with aggregation operations on logs as well as setting up and maintaining logging tools.
As a token of appreciation, here’s the GitHub repo with the PDF lecture notes compiled from the slides and transcripts. There are plenty of other valuable insights in these notes, so check them out!
You can find the summaries of the previous three courses here:
I welcome you to join me on a data science learning journey! Follow this Medium page and check out my GitHub to stay in the loop of more exciting data science content. Meanwhile, have fun building production ML systems!
Denial of responsibility! Techno Blender is an automatic aggregator of the all world’s media. In each content, the hyperlink to the primary source is specified. All trademarks belong to their rightful owners, all materials to their authors. If you are the owner of the content and do not want us to publish your materials, please contact us by email – [email protected]. The content will be deleted within 24 hours.