
Paired t-test to evaluate Machine Learning classifiers | by Marcello Politi | Jul, 2022
Learn how to compare classifiers using hypothesis testing
Introduction
In my last article I talked about the importance of properly comparing different models using statistical tools, in order to choose the best model during the selection phase.
In this article I want to focus on one statistical test in particular that as a data scientist or machine learning engineer you need to know. You can use this test in order to determine whether there is a statistically significant difference between two classifiers such that you can actually use only the best one.
k-fold cross validation
Suppose you have two classification models A and B (logistic regression, decision tree, etc…).
This paired t-test requires the use of N different test sets on which to evaluate each classifier. Fortunately, we don’t really need N test sets but can use k-fold cross validation.
This methodology allows you to test one model on several test sets to get more robust results even when you have limited data. How does it work ?
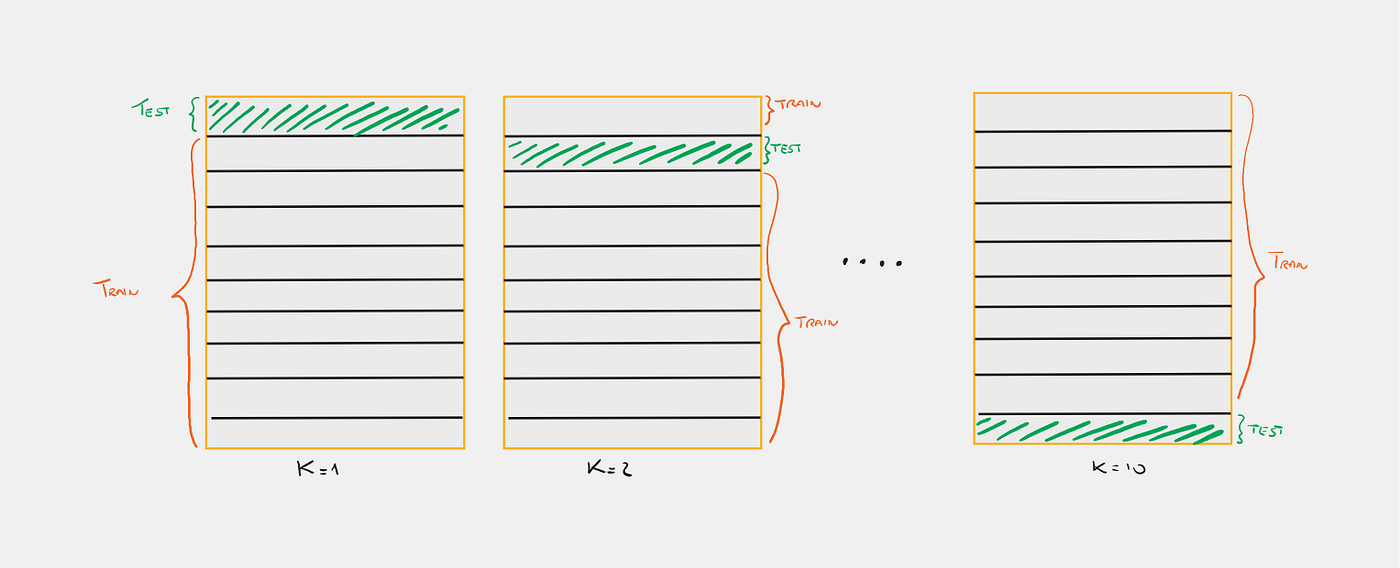
Take your dataset and split it into k equal parts, for example k = 10. Now you can use the first split as the test set and the other 9 as the train set. Next, you will use the second split as the test set and the other 9 as the train set, and so on. In this way, you will have 10 results, say 10 accuracies, on which you can typically take an average to get a more robust result.
Compute Differences
The paired t-test wants to find out if there is a real difference between the two classifiers, so assuming we are interested in the accuracy, we start by calculating the difference of the accuracies between the two models.
The accuracy of A on test set i is paired with the accuracy of B on test set i.

- Assumption: Accuracies are drawn from a normal distribution (with unknown variance)
- Null hypothesis: The accuracies of A and B are drawn from the same distribution. Hence, the difference in the accuracies has an expected value equal to 0 (E[diff]=0). Basically, there is no difference between the two models.
- Alternative hypothesis: The accuracies are drawn from two different distributions, E[diff] ≠ 0. Basically, the models are actually different, so one is better than the other.
Paired t-test
- Take a sample of N observations (given from the k-fold cv). The assumption is that these results come from a normal distribution with fixed mean and variance.
- Compute the sample mean and sample variance for these observations.
- Compute the t-statistic.
- Use the t-distribution with N-1 degrees of freedom to estimate how likely it is that the true mean is in a given range.
- Reject the null hypothesis at significance level p if the t-statistic does not lie in the following interval:

Fomulas you need
Now just follow the above steps using the following simple formulas.

Let’s complete our case
- m = ( 2 + 3 + 1 + 2)/4 = 2
- sd = [(0² + 1² + 1² + 0²) / (4–1)]^(1/2) = = 0.471
- t =(n ^(1/2) * m)/sd = 0.816
If we set a p-value = 0.05 and a degree of freedom n-1 = 3 , we can check the score on the t-table you can find here.

Is t = 0.816 in range [-3.182 , +3.182] ? Yes, so we cannot reject the null hypoth esis and there is no significant difference between our 2 classifiers.
5×2 coss validation
When you run this test on real data, you should have at least 20 to 30 test sets (k-fold), otherwise you can use a 5×2 coss validation. This paper explains this method really well. But in a few words:
In this test, we perform 5 replications of 2-fold cross-validation. In each replication, the available data are randomly partitioned into two equal-sized sets S1 and S2. Each learning algorithm (A or B) is trained on each set and tested on the other set.
Let’s code!
Let’s import the iris data and define two classifiers, a logistic regression (LR) and a decision tree classifier (DT) with max_depth = 1. We want to show that the LR performs significantly better compared to the DT. Let’s start by training both models and take a look at their accuracies.
output:
Model A accuracy: 95.56%
Model B accuracy: 64.44%
I want to set a level of significance (alpha) of 0.05. I want to be pretty sure that the models are statistically different to each other. If the p-value returned by the function is smaller than alpha we can successfully reject the null hypothesis.
output:t statistic: 7.936
aplha  0.05
p value: 0.001 Reject null hypotesis
Hypothesis testing provides a reliable framework for making data decisions about the population of interest. It helps the researcher to successfully extrapolate data from the sample to the larger population.
Comparing the result you get one time on different models to choose which one is the best, is never a good method. Statistical tests allow us to state objectively whether one model performs better. Every time you run experiments, statistical tests are used to show that what you have done is better than what existed previously, just go and read any machine learning paper. This is obviously not the only test that exists in the next article I will go on to investigate in more detail The McNemar test!
Marcello Politi

Learn how to compare classifiers using hypothesis testing
Introduction
In my last article I talked about the importance of properly comparing different models using statistical tools, in order to choose the best model during the selection phase.
In this article I want to focus on one statistical test in particular that as a data scientist or machine learning engineer you need to know. You can use this test in order to determine whether there is a statistically significant difference between two classifiers such that you can actually use only the best one.
k-fold cross validation
Suppose you have two classification models A and B (logistic regression, decision tree, etc…).
This paired t-test requires the use of N different test sets on which to evaluate each classifier. Fortunately, we don’t really need N test sets but can use k-fold cross validation.
This methodology allows you to test one model on several test sets to get more robust results even when you have limited data. How does it work ?
Take your dataset and split it into k equal parts, for example k = 10. Now you can use the first split as the test set and the other 9 as the train set. Next, you will use the second split as the test set and the other 9 as the train set, and so on. In this way, you will have 10 results, say 10 accuracies, on which you can typically take an average to get a more robust result.
Compute Differences
The paired t-test wants to find out if there is a real difference between the two classifiers, so assuming we are interested in the accuracy, we start by calculating the difference of the accuracies between the two models.
The accuracy of A on test set i is paired with the accuracy of B on test set i.
- Assumption: Accuracies are drawn from a normal distribution (with unknown variance)
- Null hypothesis: The accuracies of A and B are drawn from the same distribution. Hence, the difference in the accuracies has an expected value equal to 0 (E[diff]=0). Basically, there is no difference between the two models.
- Alternative hypothesis: The accuracies are drawn from two different distributions, E[diff] ≠ 0. Basically, the models are actually different, so one is better than the other.
Paired t-test
- Take a sample of N observations (given from the k-fold cv). The assumption is that these results come from a normal distribution with fixed mean and variance.
- Compute the sample mean and sample variance for these observations.
- Compute the t-statistic.
- Use the t-distribution with N-1 degrees of freedom to estimate how likely it is that the true mean is in a given range.
- Reject the null hypothesis at significance level p if the t-statistic does not lie in the following interval:
Fomulas you need
Now just follow the above steps using the following simple formulas.
Let’s complete our case
- m = ( 2 + 3 + 1 + 2)/4 = 2
- sd = [(0² + 1² + 1² + 0²) / (4–1)]^(1/2) = = 0.471
- t =(n ^(1/2) * m)/sd = 0.816
If we set a p-value = 0.05 and a degree of freedom n-1 = 3 , we can check the score on the t-table you can find here.
Is t = 0.816 in range [-3.182 , +3.182] ? Yes, so we cannot reject the null hypoth esis and there is no significant difference between our 2 classifiers.
5×2 coss validation
When you run this test on real data, you should have at least 20 to 30 test sets (k-fold), otherwise you can use a 5×2 coss validation. This paper explains this method really well. But in a few words:
In this test, we perform 5 replications of 2-fold cross-validation. In each replication, the available data are randomly partitioned into two equal-sized sets S1 and S2. Each learning algorithm (A or B) is trained on each set and tested on the other set.
Let’s code!
Let’s import the iris data and define two classifiers, a logistic regression (LR) and a decision tree classifier (DT) with max_depth = 1. We want to show that the LR performs significantly better compared to the DT. Let’s start by training both models and take a look at their accuracies.
output:
Model A accuracy: 95.56%
Model B accuracy: 64.44%
I want to set a level of significance (alpha) of 0.05. I want to be pretty sure that the models are statistically different to each other. If the p-value returned by the function is smaller than alpha we can successfully reject the null hypothesis.
output:t statistic: 7.936
aplha  0.05
p value: 0.001 Reject null hypotesis
Hypothesis testing provides a reliable framework for making data decisions about the population of interest. It helps the researcher to successfully extrapolate data from the sample to the larger population.
Comparing the result you get one time on different models to choose which one is the best, is never a good method. Statistical tests allow us to state objectively whether one model performs better. Every time you run experiments, statistical tests are used to show that what you have done is better than what existed previously, just go and read any machine learning paper. This is obviously not the only test that exists in the next article I will go on to investigate in more detail The McNemar test!
Marcello Politi
Denial of responsibility! Techno Blender is an automatic aggregator of the all world’s media. In each content, the hyperlink to the primary source is specified. All trademarks belong to their rightful owners, all materials to their authors. If you are the owner of the content and do not want us to publish your materials, please contact us by email – [email protected]. The content will be deleted within 24 hours.