
REST APIs on Industrial PLCs Part 2: System Health Monitoring | by Peter Lebiedzinski | Sep, 2022
Monitor the health of every device on your system
Introduction
APIs are great for offloading computation and running processes that are not easily done in a given programming language. In the first part of this series, REST APIs on Industrial PLCs¹, we implemented a simple API that adds and retrieves entries from a SQL database. The data entered into the database is for training a Machine Learning model to detect anomalies in the servo drives connected to the controller.
In this example, we will run a basic training loop for the data collected and run inference on the servos to see if they are behaving anomalously. For this, we will use an AutoEncoder network with unlabeled data and measure the reconstruction loss to determine the classification of the current servo state.
Motivation
By implementing the anomaly detection model, this allows us to monitor the health of each of the servos in the configuration. What may not be obvious to the naked eye and ear will be caught by the model and the user can act accordingly. Catching a problem with a servo early on gives us time to schedule preventative maintenance, which significantly reduces downtime and helps prevent any damage that would occur as a result of the servo failure.
Background
An AutoEncoder network will be used to identify anomalies in the servo’s state. An AutoEncoder network is suitable because it will filter out noise from the input data and provide more accurate reconstruction with non-linear relationships that may exist. Since unlabeled data will be used, the AutoEncoder network’s reconstruction loss will be used to classify anomalies. Data with a high reconstruction loss above a set threshold will be considered anomalous, and data with low reconstruction loss below the set threshold will be considered as non-anomalous.
3D Printing is a popular use of servos; running the printer at high velocities and accelerations will speed up the throughput of the printer and also cause higher dynamic loads. A printer may be run almost 100% of the time without stop, so it is useful to monitor the state of the servos in a latent fashion.
Configuration
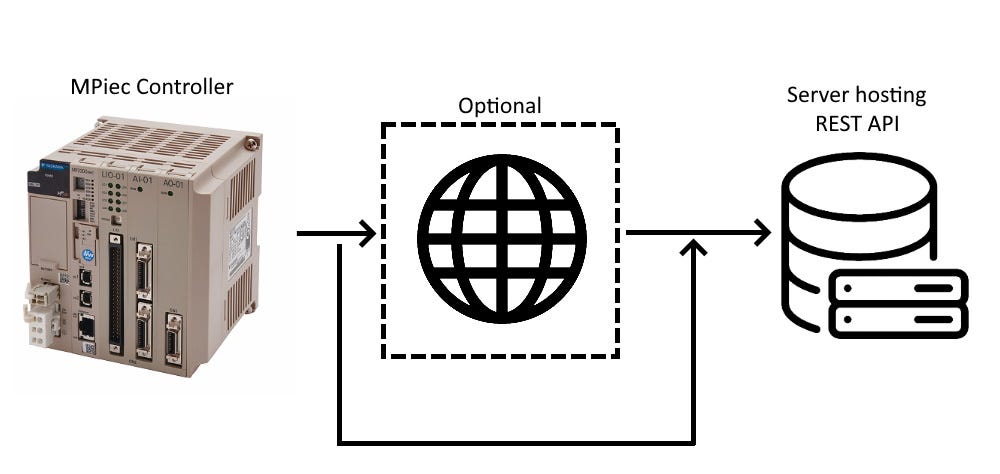
In this example, we will be creating a Compass² plugin that makes API requests for data sampling and inference. Although the API requests can be made directly from the PLC, they will be made from the PC that Compass is running on to save the trouble of routing the request to the proper external network. The network architecture for making the API requests is shown below:
The arrows on the diagram are Ethernet/IP connections. In this example, the MPiec controller will be speaking with the optional DNS server in the middle. The PC running Compass will automatically handle the DNS routing and send the requests to the proper server.
The REST API server is hosted on an AWS ec2 instance with the following endpoints available:
/api/v2/store_data #store a row(s) of data values for training/api/v2/inference #run inference on row(s)/api/v2/check #check on model availability
Model
An AutoEncoder model from the PyOD GitHub³ repository will be used to detect anomaly states on the Servo Drives. The network structure for the AutoEncoder is shown below:
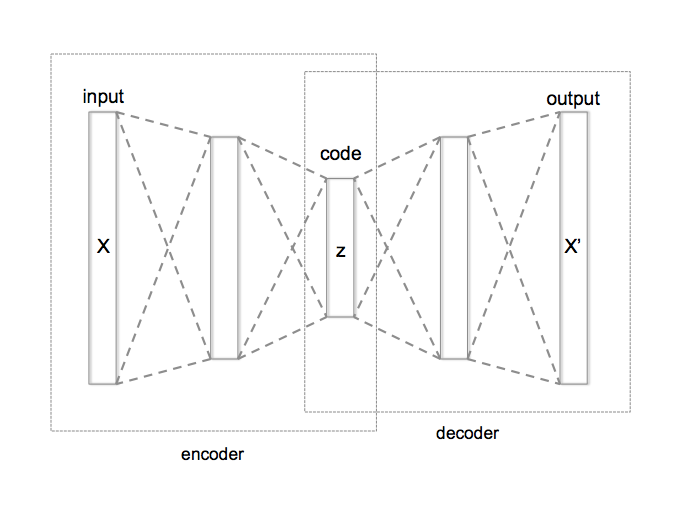
Unlike the Anomaly Detection model used in my previous article⁵ that can run directly on the PLC, the AutoEncoder is computationally expensive and must run on a different device that has more support for vectorized calculations. If you are interested in learning more about AutoEncoder networks, consider reading this paper⁵. By using an API to run inference, we reduce the cpu load on the PLC significantly and avoid performance issues.
Data
All available and relevant data from the Servo will be used for this example. A few key variables include:
- Feedback position, velocity, acceleration, and torque
- Commanded position, velocity, acceleration, and torque
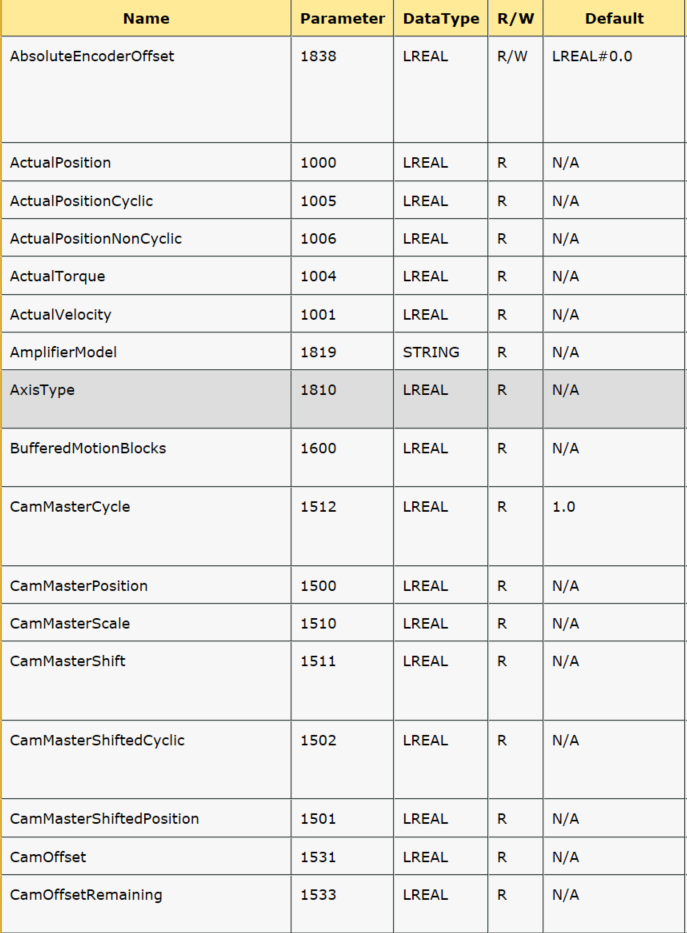
Eventually it will be optimal to reduce the amount of variables sampled to reduce the cpu load of reading variables with no significant weight on the AutoEncoder model. In this example, all of the kinematic-related Axis Parameters will be read from the following list:
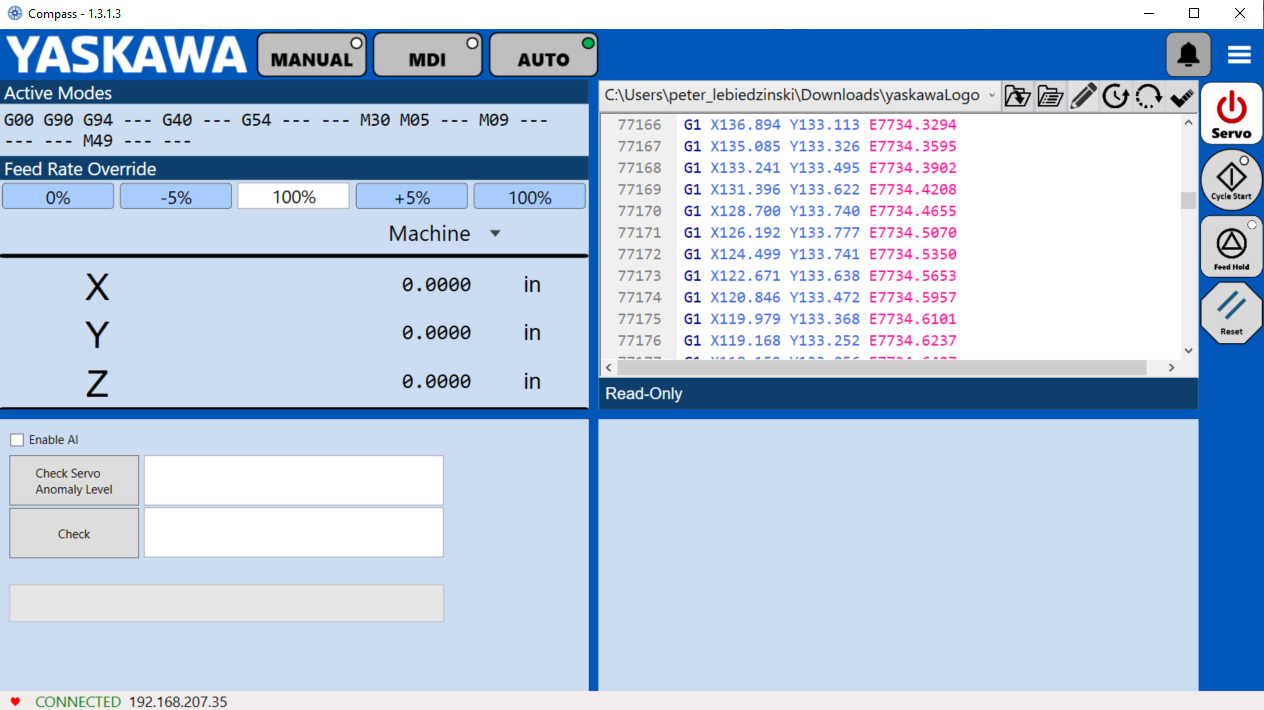
Plugin Layout
The Plugin, when enabled, will automatically sample batches of data from the servos and use the /api/v2/store_data endpoint to send the rows of data to the API for future training. We will enable the plugin and run a few G-Code files for a few hours so a diverse set of data may be sampled.
Once a sufficient amount of data are gathered, the /api/v2/check endpoint will be called. The endpoint is programmed to:
- Check on the status/availability of the AutoEncoder model
- Initiate a training session if sufficient data exist
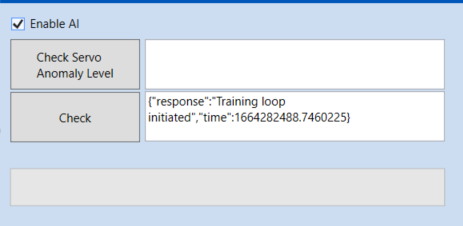
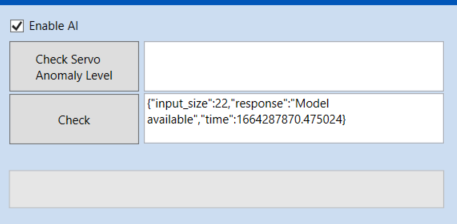
Calling the /api/v2/check endpoint for the first time will return the following:
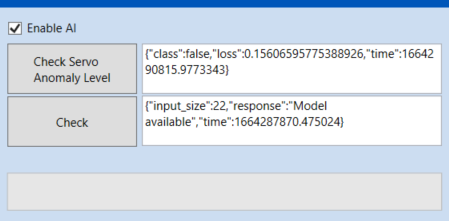
Once the AutoEncoder has completed training and is available to be used for inference the /api/v2/check endpoint will return the following:
Plugin client code
The Compass Plugin communicates with the API by making an HTTP request with the POST method. The request contains the relevant data in JSON format for the given endpoint. During inference a row or rows are sent to the API and the server will return the anomaly state of each row. The request is done in c# with the following code:

The copy-paste friendly format of Figure 7:
private async Task<InferenceResponse> InferenceRequestAPI(Dictionary<string,string> data){HttpClient client = new HttpClient();client.BaseAddress = new Uri(URL);client.DefaultRequestHeaders.Accept.Add(new MediaTypeWithQualityHeaderValue("application/json"));var jsonData = JsonConvert.SerializeObject(data);var contentData = new StringContent(jsonData, Encoding.UTF8, "application/json");var response = await client.PostAsync(urlParameters, contentData);string contents = await response.Content.ReadAsStringAsync();client.Dispose();InferenceResponse responseJSON = JsonConvert.DeserializeObject<InferenceResponse>(contents);return responseJSON;}
The server will return a response in the following format:
In the case of Figure 8 above, a single row of data is used for inference. The response has three key response items:
class— the classification of the inference (true if anomalous, false if no anomaly detected)loss— the reconstruction loss returned by the AutoEncoder model for inferencetime— the time of the inference
The classification output is based on a threshold value that uses the reconstruction loss to binarize the AutoEncoder’s outputs. In this example, the server’s training system pre-selects a threshold value based on the training data initially given. The server pre-selected a value of 0.4 as the cutoff threshold meaning that any inference with a reconstruction loss higher than 0.4 will be considered an anomaly.
For production applications, the threshold should be carefully selected by the user. Additionally, a post-processing algorithm should be implemented to track the frequency and magnitude of positive classifications so that a single positive classification does not trigger any action.
A simple and effective way to monitor the frequencies of anomalies is to track 3 SMAs (simple moving averages) at different time intervals and compare them to each other. For example, using a 5/30/120 minute set of SMAs, we can establish a ‘nominal’ value based on the 120 minute SMA and compare it to the 5 and 30 minute SMAs. When the lower interval SMAs exceed 3 standard deviations above the nominal value, we can consider sending a notification to the user that the 3D printer needs to be inspected.
Conclusion
REST APIs in combination with PLCs are extremely useful for various reasons, including the ability to easily integrate high performance Machine Learning models to monitor the health of the devices. By utilizing an API, virtually anything is possible to integrate with the PLC and it’s connected devices.
If you are interested in the ready-to-go Compass Plugin, contact me.
Sources
[1] Lebiedzinski, P. (2022, May 27). REST APIs on Industrial PLCs. Medium. Retrieved September 26, 2022, from https://towardsdatascience.com/a-single-number-metric-for-evaluating-object-detection-models-c97f4a98616d.
[2] Yaskawa compass. Yaskawa. (n.d.). Retrieved September 26, 2022, from https://www.yaskawa.com/products/motion/machine-controllers/software-tools/yaskawa-compass
[3] Zhao, Y., Nasrullah, Z. and Li, Z., 2019. PyOD: A Python Toolbox for Scalable Outlier Detection. Journal of machine learning research (JMLR), 20(96), pp.1–7.
[4] By Chervinskii — Own work, CC BY-SA 4.0, https://commons.wikimedia.org/w/index.php?curid=45555552
[5] Lebiedzinski, P. (2021, November 12). Anomaly Detection on Servo Drives. Medium. Retrieved May 12, 2022, from https://towardsdatascience.com/a-single-number-metric-for-evaluating-object-detection-models-c97f4a98616d.
[6] Le, Q. V. (2015). A Tutorial on Deep Learning Part 2: Autoencoders, Convolutional Neural Networks and Recurrent Neural Networks. Google Brain, Google Inc.
Monitor the health of every device on your system
Introduction
APIs are great for offloading computation and running processes that are not easily done in a given programming language. In the first part of this series, REST APIs on Industrial PLCs¹, we implemented a simple API that adds and retrieves entries from a SQL database. The data entered into the database is for training a Machine Learning model to detect anomalies in the servo drives connected to the controller.
In this example, we will run a basic training loop for the data collected and run inference on the servos to see if they are behaving anomalously. For this, we will use an AutoEncoder network with unlabeled data and measure the reconstruction loss to determine the classification of the current servo state.
Motivation
By implementing the anomaly detection model, this allows us to monitor the health of each of the servos in the configuration. What may not be obvious to the naked eye and ear will be caught by the model and the user can act accordingly. Catching a problem with a servo early on gives us time to schedule preventative maintenance, which significantly reduces downtime and helps prevent any damage that would occur as a result of the servo failure.
Background
An AutoEncoder network will be used to identify anomalies in the servo’s state. An AutoEncoder network is suitable because it will filter out noise from the input data and provide more accurate reconstruction with non-linear relationships that may exist. Since unlabeled data will be used, the AutoEncoder network’s reconstruction loss will be used to classify anomalies. Data with a high reconstruction loss above a set threshold will be considered anomalous, and data with low reconstruction loss below the set threshold will be considered as non-anomalous.
3D Printing is a popular use of servos; running the printer at high velocities and accelerations will speed up the throughput of the printer and also cause higher dynamic loads. A printer may be run almost 100% of the time without stop, so it is useful to monitor the state of the servos in a latent fashion.
Configuration
In this example, we will be creating a Compass² plugin that makes API requests for data sampling and inference. Although the API requests can be made directly from the PLC, they will be made from the PC that Compass is running on to save the trouble of routing the request to the proper external network. The network architecture for making the API requests is shown below:
The arrows on the diagram are Ethernet/IP connections. In this example, the MPiec controller will be speaking with the optional DNS server in the middle. The PC running Compass will automatically handle the DNS routing and send the requests to the proper server.
The REST API server is hosted on an AWS ec2 instance with the following endpoints available:
/api/v2/store_data #store a row(s) of data values for training/api/v2/inference #run inference on row(s)/api/v2/check #check on model availability
Model
An AutoEncoder model from the PyOD GitHub³ repository will be used to detect anomaly states on the Servo Drives. The network structure for the AutoEncoder is shown below:
Unlike the Anomaly Detection model used in my previous article⁵ that can run directly on the PLC, the AutoEncoder is computationally expensive and must run on a different device that has more support for vectorized calculations. If you are interested in learning more about AutoEncoder networks, consider reading this paper⁵. By using an API to run inference, we reduce the cpu load on the PLC significantly and avoid performance issues.
Data
All available and relevant data from the Servo will be used for this example. A few key variables include:
- Feedback position, velocity, acceleration, and torque
- Commanded position, velocity, acceleration, and torque
Eventually it will be optimal to reduce the amount of variables sampled to reduce the cpu load of reading variables with no significant weight on the AutoEncoder model. In this example, all of the kinematic-related Axis Parameters will be read from the following list:
Plugin Layout
The Plugin, when enabled, will automatically sample batches of data from the servos and use the /api/v2/store_data endpoint to send the rows of data to the API for future training. We will enable the plugin and run a few G-Code files for a few hours so a diverse set of data may be sampled.
Once a sufficient amount of data are gathered, the /api/v2/check endpoint will be called. The endpoint is programmed to:
- Check on the status/availability of the AutoEncoder model
- Initiate a training session if sufficient data exist
Calling the /api/v2/check endpoint for the first time will return the following:
Once the AutoEncoder has completed training and is available to be used for inference the /api/v2/check endpoint will return the following:
Plugin client code
The Compass Plugin communicates with the API by making an HTTP request with the POST method. The request contains the relevant data in JSON format for the given endpoint. During inference a row or rows are sent to the API and the server will return the anomaly state of each row. The request is done in c# with the following code:
The copy-paste friendly format of Figure 7:
private async Task<InferenceResponse> InferenceRequestAPI(Dictionary<string,string> data){HttpClient client = new HttpClient();client.BaseAddress = new Uri(URL);client.DefaultRequestHeaders.Accept.Add(new MediaTypeWithQualityHeaderValue("application/json"));var jsonData = JsonConvert.SerializeObject(data);var contentData = new StringContent(jsonData, Encoding.UTF8, "application/json");var response = await client.PostAsync(urlParameters, contentData);string contents = await response.Content.ReadAsStringAsync();client.Dispose();InferenceResponse responseJSON = JsonConvert.DeserializeObject<InferenceResponse>(contents);return responseJSON;}
The server will return a response in the following format:
In the case of Figure 8 above, a single row of data is used for inference. The response has three key response items:
class— the classification of the inference (true if anomalous, false if no anomaly detected)loss— the reconstruction loss returned by the AutoEncoder model for inferencetime— the time of the inference
The classification output is based on a threshold value that uses the reconstruction loss to binarize the AutoEncoder’s outputs. In this example, the server’s training system pre-selects a threshold value based on the training data initially given. The server pre-selected a value of 0.4 as the cutoff threshold meaning that any inference with a reconstruction loss higher than 0.4 will be considered an anomaly.
For production applications, the threshold should be carefully selected by the user. Additionally, a post-processing algorithm should be implemented to track the frequency and magnitude of positive classifications so that a single positive classification does not trigger any action.
A simple and effective way to monitor the frequencies of anomalies is to track 3 SMAs (simple moving averages) at different time intervals and compare them to each other. For example, using a 5/30/120 minute set of SMAs, we can establish a ‘nominal’ value based on the 120 minute SMA and compare it to the 5 and 30 minute SMAs. When the lower interval SMAs exceed 3 standard deviations above the nominal value, we can consider sending a notification to the user that the 3D printer needs to be inspected.
Conclusion
REST APIs in combination with PLCs are extremely useful for various reasons, including the ability to easily integrate high performance Machine Learning models to monitor the health of the devices. By utilizing an API, virtually anything is possible to integrate with the PLC and it’s connected devices.
If you are interested in the ready-to-go Compass Plugin, contact me.
Sources
[1] Lebiedzinski, P. (2022, May 27). REST APIs on Industrial PLCs. Medium. Retrieved September 26, 2022, from https://towardsdatascience.com/a-single-number-metric-for-evaluating-object-detection-models-c97f4a98616d.
[2] Yaskawa compass. Yaskawa. (n.d.). Retrieved September 26, 2022, from https://www.yaskawa.com/products/motion/machine-controllers/software-tools/yaskawa-compass
[3] Zhao, Y., Nasrullah, Z. and Li, Z., 2019. PyOD: A Python Toolbox for Scalable Outlier Detection. Journal of machine learning research (JMLR), 20(96), pp.1–7.
[4] By Chervinskii — Own work, CC BY-SA 4.0, https://commons.wikimedia.org/w/index.php?curid=45555552
[5] Lebiedzinski, P. (2021, November 12). Anomaly Detection on Servo Drives. Medium. Retrieved May 12, 2022, from https://towardsdatascience.com/a-single-number-metric-for-evaluating-object-detection-models-c97f4a98616d.
[6] Le, Q. V. (2015). A Tutorial on Deep Learning Part 2: Autoencoders, Convolutional Neural Networks and Recurrent Neural Networks. Google Brain, Google Inc.
Denial of responsibility! Techno Blender is an automatic aggregator of the all world’s media. In each content, the hyperlink to the primary source is specified. All trademarks belong to their rightful owners, all materials to their authors. If you are the owner of the content and do not want us to publish your materials, please contact us by email – [email protected]. The content will be deleted within 24 hours.