
Self-Service Data Analytics as a Hierarchy of Needs
From food and shelter to self-actualization: How to use a scientific approach to create the foundations that support self-service analytics
I’ve been thinking back to the 90s, when self-service business intelligence (BI) tools like Business Objects and Cognos first rolled out. Heck, like all overly-enthusiastic software engineers, I even helped build one in my brief stint at Citigroup. At that time, my youthful self made two very quick predictions:
- Excel is dead
- Self-service data is going to quickly take over
OK, so I’m not quite Nostradamus. After Citigroup, I found myself a decade into a career as a BI consultant — do some data engineering (ETL back then, not ELT), slap a BI tool on top, train business users, rinse and repeat. We set up some “great stuff,” but gig after gig left one unsatisfying result:
Business users were not adopting the software and self-serving at the rate we expected.
A small percentage of “power users” (often on the tech side) would pick up the tools and create varying levels of dashboards and reports, but there was no widespread adoption on the business side. And there remained a heavy dependency on consultants.
BI vendor sales pitch: 100% self-service data democracy
My expectation: 60–80% adoption
Reality: <20% adoption, optimistically
After a while, these projects began to feel like a̶n̶ ̶a̶b̶s̶o̶l̶u̶t̶e̶ ̶f̶a̶i̶l̶u̶r̶e̶ a great opportunity to learn. What was to blame? The tools, the users, IT, the consultants? We’re circa 2010 and there’s starting to be plenty of documentation of failed BI projects. Not “failed” in that projects never produced meaningful results, but failed in that they rarely reached their full potential. Business domains still had a heavy dependency on IT for data. Clean, trustworthy data was not quickly available.
An interesting thing happens at this point in time: a data visualization product called Tableau starts gaining widespread adoption. It’s everywhere, and it’s the solution to data democracy. Then Power BI comes in to compete as a best-of-both-worlds data visualization and reporting tool. However, a decade or more in, we still see the same thing with these newer tools: abysmal self-service adoption of BI tools. Clearly, I’m not alone.
The global BI adoption rate across all organizations is 26%. (360Suite 2021)
49 Shocking Business Intelligence Statistics for 2021
I couldn’t just sit on the sidelines. Naturally, I had to create what the world always needed: the BI tool to solve self-service. Yes, I would finally get it right, I told myself. So I created FlexIt Analytics with that goal. Well, remember my predictions from earlier? Yep, again, I was very wrong. Let me get straight to the point:
There never was and never will be a single magical solution to making data analytics accessible to the masses in a meaningful way.
No BI tool is going to solve self-service. What we can do, however, is take a step back and think about the problem from a “big picture,” non-tech perspective, and perhaps gain some valuable insights and strategies to move forward.
Maslow’s Hierarchy of Needs
Transport yourself back in time to high school, if you will, and try to recall that invigorating Psychology lecture on human motivation. If you didn’t cover this in school, or can’t remember, here’s a recap:
American psychologist Abraham Maslow proposed a theory of human motivation which argued that basic needs must be satisfied before a person can attain higher needs. As we move up the hierarchy, we move from lower-level short term needs like food and water to higher-level needs that have longer duration, are more complex, and increasingly difficult to attain. The highest level is self-actualization and transcendence.
In a nutshell, you need a basic foundation before you move to the next level. Anyone in the data world will immediately recognize this and understand that this applies directly to achieving the “self-actualization of data,” which is clearly “self-service.” Come on, they both have “self,” it can’t be a coincidence. Let’s dig in.
Self-Service Hierarchy of Needs
We’re going to show the same image from the top because it’s not only an Insta-worthy beaut of a graphic, but also extremely helpful in our upcoming analysis. Like Maslow’s hierarchy, the Self-Service Data Analytics Hierarchy of Needs shows how each level supports and enables the level above it. Additionally, you’ll see that the higher you go, more trust is both necessary and delivered.
One More Time, DJ:

Collection
At the base, Maslow’s physiological needs are obvious: food, water, shelter. Likewise, the base level of the Self-Service Hierarchy of Needs is obvious — data collection. You need to have collected the data. Let’s take this a step further and say that your foundation needs to collect raw data from disparate sources. In the modern data world, this is the Extract and Load portion of ELT (Extract, Load, Transform), and results in what we’ll call a Data Lake, for simplicity sake. Note the differentiation between the traditional/older data warehousing concept of ETL (Extract -> Transform -> Load), that is no longer relevant for many reasons that we’ll cover in another article.
The last point to make here is that any data analysis produced from this level will need to be done by higher-skill analysts/data scientists, and has a lower level of trust in that it hasn’t gone through the higher levels of the hierarchy. The analogy would be something like this: can you skip right to the top-level transcendence? Maybe, but at the end of the weekend when the party is over, it’s unlikely you’ll be able to sustain it.
Transformation
The next level in Maslow’s hierarchy is safety, which includes things like security, social stability, predictability, and control. In our Self-Service Hierarchy, we achieve that predictability, stability, and control by cleaning and organizing our data as business models in our data warehouse. This often takes the form of multi-dimensional star schema models. With the raw source data from the lower Collection level, analysts might have to join lots of disparate tables together for customer data. In this level, that disparate data has been brought together in a common table, called the Customer Dimension. Also in this process, data is cleaned (duplicate, mismatching names for the same customer) and helpful calculations are pre-computed (e.g., first order date), allowing for much simpler SQL.
At the end, we’ve established another level of safety and trust in the data, but also enabled a new group of analysts with self-service because they don’t need to know the business complexity of the underlying source data. Also very important to note, at this level we should see involvement from business domain owners. The transformation process is meant to support real business needs, so business owners must be involved. In the modern data world, we start to see “analytic engineers” as a critical role to support this hybrid need.
Semantic Layer
Maslow’s third level is love and belonging through relationships and connectedness. The correlation with our Self-Service Hierarchy is uncanny, as the semantic layer is literally where you set up your relationships (table joins), and is what brings everything together. I could go on-and-on with semantic-layers, and do in the post linked here:
“Semantic-free” is the future of Business Intelligence
I’ll argue that this level is the most important for enabling true self-service, and that business domain owners need to be heavily involved. The “universal semantic layer” can provide a single-source of truth that powers self-service analytics through data literacy, simplicity, and trust. Analysts can rely on business-friendly field and entity names, data catalog descriptions, and perhaps most importantly, they do not need to know how tables join to each other (or at least how to write the SQL). We also have access to critical things like data lineage (trace a field back to the source table), synonyms (you call it “sales”, I call it “revenue”), and data freshness (when was the data last refreshed).
One important thing to note here, especially for you historians who might say “Business Objects had this in the 90s.” We’ve not yet reached the “Analysis layer” (BI tool level). For many reasons, which are elaborated upon in the post linked above (“Semantic-free is the future of Business Intelligence”), it is critical that you do not stuff your business logic semantic layer into a BI tool. The “semantic layer” level in our Self-Service Hierarchy should support the next layer, not be it.
Analysis
At this level, now we’re talking BI tools, reports, dashboards, and what most people think about when we talk about self-service analytics. If you found the semantic-layer correlation to Maslow’s hierarchy as uncanny as I did, then hold on to your seats for Maslow’s self-esteem level. Here, he breaks needs into “lower” version needs like status, recognition, fame, prestige, and attention, as well as “higher” version needs like strength, competence, mastery, self-confidence, independence, and freedom. Hello “data heroes,” “Zen Masters,” and gurus.
At this level in our Self-Service Hierarchy, we start to see business domain ownership and self-service analytics, with a focus on two of the four types of analytics:
1. Descriptive — reports and dashboards that show what happened
2. Diagnostic — analysis that shows why that happened
You’re building your dashboards from a clean data warehouse with a well-modeled transformation layer and universal semantic layer on top, right?
Paradoxically, it might be the BI tools that we thought were enabling self-service that were actually doing the biggest disservice. We know that Tableau (an incredible viz tool with enormous value, to be sure) gained early traction in bypassing slow-moving IT and selling directly to the business, and continues to exploit this divide. Far too many implementations involve exporting data from hand-written SQL on source databases or static BI reports, and importing that .CSV into Tableau. While you can choose to eat healthy at this all-you-can-eat buffet, the reality is often quite different. The mess that ensues can often bog down businesses so much that they will never reach the next levels, so they continue to produce only descriptive dashboards about things that happened.
Self-Actualization and Transcendence
The highest level of Maslow’s hierarchy is around self-fulfillment, personal growth, and reaching your full potential. Similar to life, in the data world, there is no pinnacle that you reach and say “that’s it, all done.” It’s a constant work-in-progress, very difficult to attain, and can seemingly go on forever. At this level, we move beyond the basic descriptive and diagnostic analytics, and have established a very high level of trust in our data and process. This enables the next two types of analytics:
3. Predictive — figuring out what will happen next
4. Prescriptive — based on predictions, recommend the optimal path forward
At this point, we have a strong foundation in all our layers of data and can start to make meaningful strides towards leveraging artificial intelligence, automating business processes, and tackling more advanced use-cases.
Components of a Data-driven Organization
OK, so we’ve established a framework for improving our “data life,” with the lofty goal of data self-actualization. Now, let’s dig in and figure out how we get there. First, let’s take a look at what we need to focus on: people, process, and tools.
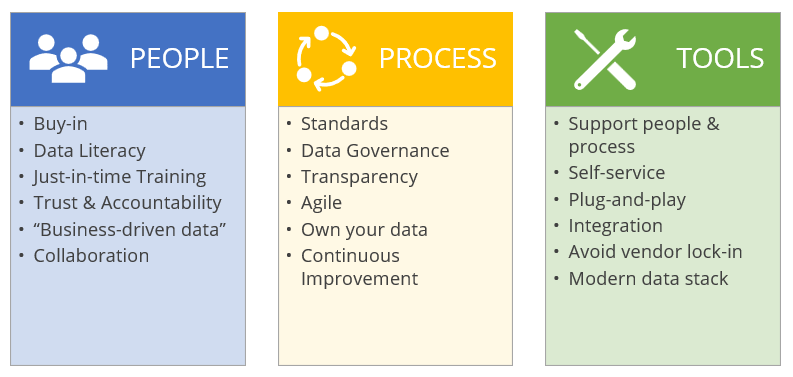
People
I come from the Tech side, so want to create technical solutions to solve business problems. Surely, if I get some business requirements, lock myself in a dark room, and bang out some code, then I can create a piece of software to answer the business needs. My mistake, and the mistake of many others, is a lack of focus on the softer side of things: people. This sounds obvious, but I think us Tech folks need to admit that we often create incredible software products and then hand them to business users and say “Tada, here it is!” We’re baffled when it’s not used the way we anticipated, or they “just don’t get it.”
The human side of technology can be baffling and mystifying, but it doesn’t need to be. At the core of this, we need to establish trust and competency by focusing on a few key areas. First, there has to be buy-in, otherwise the forces pushing against you can derail even great technical solutions. With that, there has to be serious collaboration with the idea that we’re working toward a “business-driven” data solution rather than a “data-driven” solution. Everything we do has to be with the business needs in mind. As we build, we need to think about how we can enable competency in our delivered product. In the data world, how can we enable “data literacy?” Sure, the business should know their data, but when we put their business through the technical grinder and then present it back to them, it’s not always as obvious as we think. We need to enable data-literacy with data catalogs and semantic layers. Finally, when we roll out our solutions, we can’t just do standard roll-out sessions and trainings that come off as lectures. We need to focus on “just-in-time” training that focuses on real data needs at the moment in time when a business user needs to solve real data problems.
Process
Even if we get the people part right, we can still be easily derailed. To stay on track, we need to also get the process part right. One of the most obvious issues in the past few decades, especially on the Tech side, is that many projects were undertaken with a waterfall approach, where the end result is supposed to be established at the start of the project. Our first step, especially in the data world where building our data-driven org can take many years, is to be nimble and focus on the ever-changing business needs by taking an agile approach.
Agile was developed as a flexible method that welcomes incorporating changes of direction even late in the process, as well as accounting for stakeholders’ feedback throughout the process. — Forbes
Agile Vs. Waterfall: Which Project Management Methodology Is Best For You?
One of the big mistakes of people doing “agile” is that they do a bunch of disparate sprint projects that don’t result in a coherent end product. We must have an end goal in mind, even if we’re not taking a waterfall approach. There must be standards and data governance in place to make sure we stay focused on this end goal. It’s also important that the business side owns their data, rather than Tech. They need to be intimately involved in this process. Finally, the process needs to focus on continuous improvement. What’s working? What’s not working? Why? Then, go fix these and continue to deliver.
Tools
Early on, we relied on the tools to be our magic solutions to our problems. As I established earlier, the tools are not the solution. They’re not even close to 1/3rd of the solution. I think it’s something like 50% People, 30% Process, and only 20% Tools. Being a BI tool provider, that’s a rough outlook. Nevertheless, it’s true.
With that being said, there are a handful of things the tools can do to enable the overall people and process components. Clearly, they need to be intuitive so that they don’t require deep knowledge of how to use them, and I think that a lot of modern BI tools do that. One of the areas where I think they’re lacking is in the “plug-and-play.” As I mentioned earlier, we put too much business logic in our tools, so switching from one tool to another is a major lift. Not to mention the fact that many organizations have 3 or more BI tools, often accessing the same datasets. What we need to do is take that business logic out of the BI tool and push it down to a centralized semantic layer that all BI tools can plug in to.
Additionally, our tools need to integrate with other tools rather than try to be one monolithic do-it-all tool. This is one area that the “modern data stack” gets right, but it’s important that we don’t go too far the other way and have 100’s of tools that create a confusing and messy architecture. At the end of the day, remember that the tools are just here to support the people and process.
Steps to Create a Data-driven Organization
Now that we’ve established a framework and the overall components of a data-driven organization, let’s talk about how we get there.
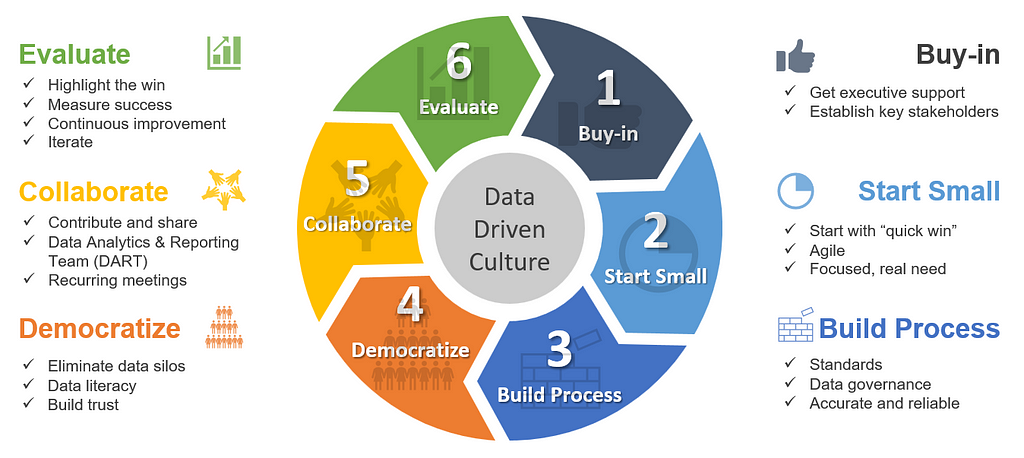
Step 1: Buy-in
First things first, you need to establish key stakeholders and get buy-in from the executive level. Without this, you risk lacking the “people-power” to deliver on your self-service framework and components. Getting widespread buy-in can be very difficult, so figure out who can be the early champions. At the end of these steps, you will start again at step 1, continuing to build your data driven organization and getting more buy-in along the way. You’re going for a snowball effect here.
Step 2: Start Small
Continuing the snowball analogy, we’re building a snowman. With that, of course we start small and build up. We’re thinking of the thing we’re building in components, and we take an agile approach, taking an agile approach to deliver on real business needs. We want a “quick win” in our first iteration so that we can compound on these positive results, getting more people bought in along the way.
Step 3: Build Process
These agile “quick wins” are at risk of creating wild-west messy architectures. This is why we immediately establish standards and data governance, which provide a foundation and keep us laser focused on delivering quality, accurate and reliable data products. Tools like Github go a long way in supporting our standards and data governance.
Step 4: Democratize
The data governance will allow us to more safely roll out these data products with more confidence and less risk. In democratizing our data, we need to:
- Eliminate data silos — these are “black-box” data sources controlled by one department, often Tech, and isolated from the broader organization.
- Build data literacy — we cannot expect the business users to immediately understand the what IT is delivering, even though it’s their data. Data catalogs can go a long way to support data literacy, but this can be tricky. Oftentimes, we end up with spreadsheet data dictionaries that get stale and wind up gathering dust. We need to move to a more dynamic and active data catalog that allows business users to take action on the data catalog entities, as well as provide feedback on definitions, etc. for continuous improvement.
- Build trust — to democratize data, IT needs to trust that the business is going to use the data properly. The business needs to trust that IT is going to deliver accurate, reliable, and timely data. Every step of the way, trust needs to be established and maintained.
Step 5: Collaborate
Now that we’ve taken steps to democratize data, we need to make sure we’re collaborating and working together to develop solutions, but also to provide critical feedback that will improve things. It is important to form some sort of DART (Data Analytics and Reporting Team) group that has a cross section of members from tech to business and meets regularly to work through issues.
Step 6: Evaluate
At the end, we need to highlight the win while also making sure we constructively discuss things that did not work or needs to be improved. Without being too dogmatic, or making up KPI’s, we need to figure out a way to measure success. Are people happy with the results from this first iteration? Did we create an immediately useful data product? Then, we iterate and continuously improve on what worked and what did not work.
Then, rinse-and-repeat, start back at step 1 with more buy-in and a next results-driven project.
Closing Thoughts
Putting it all together, we covered three key areas to focus and create our data-driven organization and enable self-service. One very important thing to note is that we are not going from zero self-service to a fully data-democratized organization. We’re trying to move the needle, bit by bit, and continuously improve to enable more people in the organization to be involved in data. To recap, here are the three ways we can focus this effort:
- The Framework — a hierarchy of needs that can inform what we need to build to enable a data-driven organization
- The Components — the components of this data-driven organization, namely the people, process, and tools.
- Steps to Create — a six step approach that focuses on these components to build our data-driven organization within the framework.
Good luck in your self-service endeavors!
Please comment, I’d love to hear your thoughts here, or reach out to Andrew Taft
Self-Service Data Analytics as a Hierarchy of Needs was originally published in Towards Data Science on Medium, where people are continuing the conversation by highlighting and responding to this story.
From food and shelter to self-actualization: How to use a scientific approach to create the foundations that support self-service analytics
I’ve been thinking back to the 90s, when self-service business intelligence (BI) tools like Business Objects and Cognos first rolled out. Heck, like all overly-enthusiastic software engineers, I even helped build one in my brief stint at Citigroup. At that time, my youthful self made two very quick predictions:
- Excel is dead
- Self-service data is going to quickly take over
OK, so I’m not quite Nostradamus. After Citigroup, I found myself a decade into a career as a BI consultant — do some data engineering (ETL back then, not ELT), slap a BI tool on top, train business users, rinse and repeat. We set up some “great stuff,” but gig after gig left one unsatisfying result:
Business users were not adopting the software and self-serving at the rate we expected.
A small percentage of “power users” (often on the tech side) would pick up the tools and create varying levels of dashboards and reports, but there was no widespread adoption on the business side. And there remained a heavy dependency on consultants.
BI vendor sales pitch: 100% self-service data democracy
My expectation: 60–80% adoption
Reality: <20% adoption, optimistically
After a while, these projects began to feel like a̶n̶ ̶a̶b̶s̶o̶l̶u̶t̶e̶ ̶f̶a̶i̶l̶u̶r̶e̶ a great opportunity to learn. What was to blame? The tools, the users, IT, the consultants? We’re circa 2010 and there’s starting to be plenty of documentation of failed BI projects. Not “failed” in that projects never produced meaningful results, but failed in that they rarely reached their full potential. Business domains still had a heavy dependency on IT for data. Clean, trustworthy data was not quickly available.
An interesting thing happens at this point in time: a data visualization product called Tableau starts gaining widespread adoption. It’s everywhere, and it’s the solution to data democracy. Then Power BI comes in to compete as a best-of-both-worlds data visualization and reporting tool. However, a decade or more in, we still see the same thing with these newer tools: abysmal self-service adoption of BI tools. Clearly, I’m not alone.
The global BI adoption rate across all organizations is 26%. (360Suite 2021)
49 Shocking Business Intelligence Statistics for 2021
I couldn’t just sit on the sidelines. Naturally, I had to create what the world always needed: the BI tool to solve self-service. Yes, I would finally get it right, I told myself. So I created FlexIt Analytics with that goal. Well, remember my predictions from earlier? Yep, again, I was very wrong. Let me get straight to the point:
There never was and never will be a single magical solution to making data analytics accessible to the masses in a meaningful way.
No BI tool is going to solve self-service. What we can do, however, is take a step back and think about the problem from a “big picture,” non-tech perspective, and perhaps gain some valuable insights and strategies to move forward.
Maslow’s Hierarchy of Needs
Transport yourself back in time to high school, if you will, and try to recall that invigorating Psychology lecture on human motivation. If you didn’t cover this in school, or can’t remember, here’s a recap:
American psychologist Abraham Maslow proposed a theory of human motivation which argued that basic needs must be satisfied before a person can attain higher needs. As we move up the hierarchy, we move from lower-level short term needs like food and water to higher-level needs that have longer duration, are more complex, and increasingly difficult to attain. The highest level is self-actualization and transcendence.
In a nutshell, you need a basic foundation before you move to the next level. Anyone in the data world will immediately recognize this and understand that this applies directly to achieving the “self-actualization of data,” which is clearly “self-service.” Come on, they both have “self,” it can’t be a coincidence. Let’s dig in.
Self-Service Hierarchy of Needs
We’re going to show the same image from the top because it’s not only an Insta-worthy beaut of a graphic, but also extremely helpful in our upcoming analysis. Like Maslow’s hierarchy, the Self-Service Data Analytics Hierarchy of Needs shows how each level supports and enables the level above it. Additionally, you’ll see that the higher you go, more trust is both necessary and delivered.
One More Time, DJ:
Collection
At the base, Maslow’s physiological needs are obvious: food, water, shelter. Likewise, the base level of the Self-Service Hierarchy of Needs is obvious — data collection. You need to have collected the data. Let’s take this a step further and say that your foundation needs to collect raw data from disparate sources. In the modern data world, this is the Extract and Load portion of ELT (Extract, Load, Transform), and results in what we’ll call a Data Lake, for simplicity sake. Note the differentiation between the traditional/older data warehousing concept of ETL (Extract -> Transform -> Load), that is no longer relevant for many reasons that we’ll cover in another article.
The last point to make here is that any data analysis produced from this level will need to be done by higher-skill analysts/data scientists, and has a lower level of trust in that it hasn’t gone through the higher levels of the hierarchy. The analogy would be something like this: can you skip right to the top-level transcendence? Maybe, but at the end of the weekend when the party is over, it’s unlikely you’ll be able to sustain it.
Transformation
The next level in Maslow’s hierarchy is safety, which includes things like security, social stability, predictability, and control. In our Self-Service Hierarchy, we achieve that predictability, stability, and control by cleaning and organizing our data as business models in our data warehouse. This often takes the form of multi-dimensional star schema models. With the raw source data from the lower Collection level, analysts might have to join lots of disparate tables together for customer data. In this level, that disparate data has been brought together in a common table, called the Customer Dimension. Also in this process, data is cleaned (duplicate, mismatching names for the same customer) and helpful calculations are pre-computed (e.g., first order date), allowing for much simpler SQL.
At the end, we’ve established another level of safety and trust in the data, but also enabled a new group of analysts with self-service because they don’t need to know the business complexity of the underlying source data. Also very important to note, at this level we should see involvement from business domain owners. The transformation process is meant to support real business needs, so business owners must be involved. In the modern data world, we start to see “analytic engineers” as a critical role to support this hybrid need.
Semantic Layer
Maslow’s third level is love and belonging through relationships and connectedness. The correlation with our Self-Service Hierarchy is uncanny, as the semantic layer is literally where you set up your relationships (table joins), and is what brings everything together. I could go on-and-on with semantic-layers, and do in the post linked here:
“Semantic-free” is the future of Business Intelligence
I’ll argue that this level is the most important for enabling true self-service, and that business domain owners need to be heavily involved. The “universal semantic layer” can provide a single-source of truth that powers self-service analytics through data literacy, simplicity, and trust. Analysts can rely on business-friendly field and entity names, data catalog descriptions, and perhaps most importantly, they do not need to know how tables join to each other (or at least how to write the SQL). We also have access to critical things like data lineage (trace a field back to the source table), synonyms (you call it “sales”, I call it “revenue”), and data freshness (when was the data last refreshed).
One important thing to note here, especially for you historians who might say “Business Objects had this in the 90s.” We’ve not yet reached the “Analysis layer” (BI tool level). For many reasons, which are elaborated upon in the post linked above (“Semantic-free is the future of Business Intelligence”), it is critical that you do not stuff your business logic semantic layer into a BI tool. The “semantic layer” level in our Self-Service Hierarchy should support the next layer, not be it.
Analysis
At this level, now we’re talking BI tools, reports, dashboards, and what most people think about when we talk about self-service analytics. If you found the semantic-layer correlation to Maslow’s hierarchy as uncanny as I did, then hold on to your seats for Maslow’s self-esteem level. Here, he breaks needs into “lower” version needs like status, recognition, fame, prestige, and attention, as well as “higher” version needs like strength, competence, mastery, self-confidence, independence, and freedom. Hello “data heroes,” “Zen Masters,” and gurus.
At this level in our Self-Service Hierarchy, we start to see business domain ownership and self-service analytics, with a focus on two of the four types of analytics:
1. Descriptive — reports and dashboards that show what happened
2. Diagnostic — analysis that shows why that happened
You’re building your dashboards from a clean data warehouse with a well-modeled transformation layer and universal semantic layer on top, right?
Paradoxically, it might be the BI tools that we thought were enabling self-service that were actually doing the biggest disservice. We know that Tableau (an incredible viz tool with enormous value, to be sure) gained early traction in bypassing slow-moving IT and selling directly to the business, and continues to exploit this divide. Far too many implementations involve exporting data from hand-written SQL on source databases or static BI reports, and importing that .CSV into Tableau. While you can choose to eat healthy at this all-you-can-eat buffet, the reality is often quite different. The mess that ensues can often bog down businesses so much that they will never reach the next levels, so they continue to produce only descriptive dashboards about things that happened.
Self-Actualization and Transcendence
The highest level of Maslow’s hierarchy is around self-fulfillment, personal growth, and reaching your full potential. Similar to life, in the data world, there is no pinnacle that you reach and say “that’s it, all done.” It’s a constant work-in-progress, very difficult to attain, and can seemingly go on forever. At this level, we move beyond the basic descriptive and diagnostic analytics, and have established a very high level of trust in our data and process. This enables the next two types of analytics:
3. Predictive — figuring out what will happen next
4. Prescriptive — based on predictions, recommend the optimal path forward
At this point, we have a strong foundation in all our layers of data and can start to make meaningful strides towards leveraging artificial intelligence, automating business processes, and tackling more advanced use-cases.
Components of a Data-driven Organization
OK, so we’ve established a framework for improving our “data life,” with the lofty goal of data self-actualization. Now, let’s dig in and figure out how we get there. First, let’s take a look at what we need to focus on: people, process, and tools.
People
I come from the Tech side, so want to create technical solutions to solve business problems. Surely, if I get some business requirements, lock myself in a dark room, and bang out some code, then I can create a piece of software to answer the business needs. My mistake, and the mistake of many others, is a lack of focus on the softer side of things: people. This sounds obvious, but I think us Tech folks need to admit that we often create incredible software products and then hand them to business users and say “Tada, here it is!” We’re baffled when it’s not used the way we anticipated, or they “just don’t get it.”
The human side of technology can be baffling and mystifying, but it doesn’t need to be. At the core of this, we need to establish trust and competency by focusing on a few key areas. First, there has to be buy-in, otherwise the forces pushing against you can derail even great technical solutions. With that, there has to be serious collaboration with the idea that we’re working toward a “business-driven” data solution rather than a “data-driven” solution. Everything we do has to be with the business needs in mind. As we build, we need to think about how we can enable competency in our delivered product. In the data world, how can we enable “data literacy?” Sure, the business should know their data, but when we put their business through the technical grinder and then present it back to them, it’s not always as obvious as we think. We need to enable data-literacy with data catalogs and semantic layers. Finally, when we roll out our solutions, we can’t just do standard roll-out sessions and trainings that come off as lectures. We need to focus on “just-in-time” training that focuses on real data needs at the moment in time when a business user needs to solve real data problems.
Process
Even if we get the people part right, we can still be easily derailed. To stay on track, we need to also get the process part right. One of the most obvious issues in the past few decades, especially on the Tech side, is that many projects were undertaken with a waterfall approach, where the end result is supposed to be established at the start of the project. Our first step, especially in the data world where building our data-driven org can take many years, is to be nimble and focus on the ever-changing business needs by taking an agile approach.
Agile was developed as a flexible method that welcomes incorporating changes of direction even late in the process, as well as accounting for stakeholders’ feedback throughout the process. — Forbes
Agile Vs. Waterfall: Which Project Management Methodology Is Best For You?
One of the big mistakes of people doing “agile” is that they do a bunch of disparate sprint projects that don’t result in a coherent end product. We must have an end goal in mind, even if we’re not taking a waterfall approach. There must be standards and data governance in place to make sure we stay focused on this end goal. It’s also important that the business side owns their data, rather than Tech. They need to be intimately involved in this process. Finally, the process needs to focus on continuous improvement. What’s working? What’s not working? Why? Then, go fix these and continue to deliver.
Tools
Early on, we relied on the tools to be our magic solutions to our problems. As I established earlier, the tools are not the solution. They’re not even close to 1/3rd of the solution. I think it’s something like 50% People, 30% Process, and only 20% Tools. Being a BI tool provider, that’s a rough outlook. Nevertheless, it’s true.
With that being said, there are a handful of things the tools can do to enable the overall people and process components. Clearly, they need to be intuitive so that they don’t require deep knowledge of how to use them, and I think that a lot of modern BI tools do that. One of the areas where I think they’re lacking is in the “plug-and-play.” As I mentioned earlier, we put too much business logic in our tools, so switching from one tool to another is a major lift. Not to mention the fact that many organizations have 3 or more BI tools, often accessing the same datasets. What we need to do is take that business logic out of the BI tool and push it down to a centralized semantic layer that all BI tools can plug in to.
Additionally, our tools need to integrate with other tools rather than try to be one monolithic do-it-all tool. This is one area that the “modern data stack” gets right, but it’s important that we don’t go too far the other way and have 100’s of tools that create a confusing and messy architecture. At the end of the day, remember that the tools are just here to support the people and process.
Steps to Create a Data-driven Organization
Now that we’ve established a framework and the overall components of a data-driven organization, let’s talk about how we get there.
Step 1: Buy-in
First things first, you need to establish key stakeholders and get buy-in from the executive level. Without this, you risk lacking the “people-power” to deliver on your self-service framework and components. Getting widespread buy-in can be very difficult, so figure out who can be the early champions. At the end of these steps, you will start again at step 1, continuing to build your data driven organization and getting more buy-in along the way. You’re going for a snowball effect here.
Step 2: Start Small
Continuing the snowball analogy, we’re building a snowman. With that, of course we start small and build up. We’re thinking of the thing we’re building in components, and we take an agile approach, taking an agile approach to deliver on real business needs. We want a “quick win” in our first iteration so that we can compound on these positive results, getting more people bought in along the way.
Step 3: Build Process
These agile “quick wins” are at risk of creating wild-west messy architectures. This is why we immediately establish standards and data governance, which provide a foundation and keep us laser focused on delivering quality, accurate and reliable data products. Tools like Github go a long way in supporting our standards and data governance.
Step 4: Democratize
The data governance will allow us to more safely roll out these data products with more confidence and less risk. In democratizing our data, we need to:
- Eliminate data silos — these are “black-box” data sources controlled by one department, often Tech, and isolated from the broader organization.
- Build data literacy — we cannot expect the business users to immediately understand the what IT is delivering, even though it’s their data. Data catalogs can go a long way to support data literacy, but this can be tricky. Oftentimes, we end up with spreadsheet data dictionaries that get stale and wind up gathering dust. We need to move to a more dynamic and active data catalog that allows business users to take action on the data catalog entities, as well as provide feedback on definitions, etc. for continuous improvement.
- Build trust — to democratize data, IT needs to trust that the business is going to use the data properly. The business needs to trust that IT is going to deliver accurate, reliable, and timely data. Every step of the way, trust needs to be established and maintained.
Step 5: Collaborate
Now that we’ve taken steps to democratize data, we need to make sure we’re collaborating and working together to develop solutions, but also to provide critical feedback that will improve things. It is important to form some sort of DART (Data Analytics and Reporting Team) group that has a cross section of members from tech to business and meets regularly to work through issues.
Step 6: Evaluate
At the end, we need to highlight the win while also making sure we constructively discuss things that did not work or needs to be improved. Without being too dogmatic, or making up KPI’s, we need to figure out a way to measure success. Are people happy with the results from this first iteration? Did we create an immediately useful data product? Then, we iterate and continuously improve on what worked and what did not work.
Then, rinse-and-repeat, start back at step 1 with more buy-in and a next results-driven project.
Closing Thoughts
Putting it all together, we covered three key areas to focus and create our data-driven organization and enable self-service. One very important thing to note is that we are not going from zero self-service to a fully data-democratized organization. We’re trying to move the needle, bit by bit, and continuously improve to enable more people in the organization to be involved in data. To recap, here are the three ways we can focus this effort:
- The Framework — a hierarchy of needs that can inform what we need to build to enable a data-driven organization
- The Components — the components of this data-driven organization, namely the people, process, and tools.
- Steps to Create — a six step approach that focuses on these components to build our data-driven organization within the framework.
Good luck in your self-service endeavors!
Please comment, I’d love to hear your thoughts here, or reach out to Andrew Taft
Self-Service Data Analytics as a Hierarchy of Needs was originally published in Towards Data Science on Medium, where people are continuing the conversation by highlighting and responding to this story.
Denial of responsibility! Techno Blender is an automatic aggregator of the all world’s media. In each content, the hyperlink to the primary source is specified. All trademarks belong to their rightful owners, all materials to their authors. If you are the owner of the content and do not want us to publish your materials, please contact us by email – [email protected]. The content will be deleted within 24 hours.