
Simple Market Basket Analysis with Association Rules Mining | by Chi Nguyen | Jul, 2022
Understanding the customer behaviors through concepts, the working mechanism of Association Rules Mining, and Python code
You must have noticed that the seller at the Pizza store makes a combo of pizza, soft drinks, and chips. He also gives discounts to their customers who buy these combos. Have you ever wondered why he would do that?
It’s because he discovers customers who buy pizza also buy soft drinks and chips. By doing combos, he made it easy for customers. At the same time, he also increased his sales performance.
From the above small example, there is no denying the importance of collecting and analyzing user behavior to create effective cross-sell and upsell strategies in sales. Based on data on user behaviors, we may use RFM and cluster analysis to divide customers into different groups to have customized service care for each group. However, to predict other products customers may buy, one of the methods that analysts often use to understand the customer purchasing habit is association rule mining.
In today’s article, I will give you the most overview information about this technique and how to use it to understand customers better.
Based on the transaction history, many patterns can be exploited to understand customer behaviors. One of the insights that can be achieved is the associations between items purchased. Using the data of all items bought, we can determine which items are usually purchased or purchased together, thereby defining and building up product association models. Conclusions must be tested for probability and reliability. For example, a person goes to a supermarket to buy bread. It is an 80% chance that he/she might purchase jam or ham to eat with bread with 90% confidence.

Then, retailers may use the analytical results to position, recommend, and navigate products in a store, to promote cross-selling between products or product categories.
Apriori is an algorithm that exploits sets of objects in data related to each other. In other words, it helps identify frequently occurring item sets. Let’s talk about apriori with a minimum occurrence threshold of one. The procedure begins with finding individual objects that meet a minimal occurrence requirement. It then expands the item set one item at a time, checking to see if the more extensive item set still meets the pre-defined threshold. The algorithm terminates when there are no more items to add that fulfill the minimum occurrence condition.
Assuming that we have 4 orders, each order is described as follows:

In these 4 orders, we have 3 orders that include apples, 3 that include bananas, and 2 that include bananas and apples. Using this information, I will calculate some crucial metrics of Apriori, including Support, Confidence, and Lift.
Support
This is the proportion of orders that include the item set. As you can see in the above example, 3 orders include bananas in a total of 4 orders, therefore:
Support (bananas)
= Bananas related orders/Total orders
= 3/4 = 0.75
Confidence
In this example, confidence expresses the percentage of times apples are purchased after bananas have been purchased. So, the formula can be shown below:
Confidence (bananas -> apples)
= support (bananas, apples) / support (bananas)
=(2/4)/(3/4) = 0.6667
The value of 66.67% means that 66.67% of customers who buy bananas also purchase apples. However, does this number suggest a relationship between these two fruits, or are they merely purchasing together by chance? To answer this question, we will have to look at another metric that considers the popularity of both things.
The support and confidence thresholds are set differently depending on business purposes, research contexts, and industry domains. For example, when analyzing financial fraud, the support value might be 1% as there will be relatively few transactions that exhibit fraud in the data set. Therefore, there is no specific standard for deciding a particular threshold.
Lift
This metric shows if there is actually an association between items or if the purchase of these items is just a random combination. From the example, we can quickly compute lift as:
Lift(bananas, apples) = Lift(apples, bananas)
= support(bananas, apples) / (support(bananas) * support(apples))
=(2/4)/(0.75*0.75) = 0.89
So, the measure implies that if bananas appear in 75% of the orders, apples appear in 75% of the orders, and there is no link between these 2 items, apples and bananas are expected to be bought together 75% * 75% = 56.25% of the time. Meanwhile, the numerator reflects the frequency with which apples and bananas come together in the same order. That is 50% of the time in this scenario. Getting this value and dividing by 56.25% shows how many more times apples and bananas appear in the same order than if they have no association.
Based on the result of lift values, we can have some inferences:
- lift = 1: items are randomly bought together. In other words, there is no relationship between items.
- lift > 1: items are purchased together more frequently than random.
- lift < 1: items are bought together less regularly than random.
In the example above, apples and bananas appear together 0.89 times more than random. Therefore, we can tell there is a negative relationship between these 2 items.
Now, let’s see how the association rules mining works in a real dataset.
For this article, I will use a dataset from a bakery (License: CC0: Public Domain). This dataset includes 20507 entries, over 9000 transactions, and 5 columns. You can download the data from this link.
The overview of the dataset can be seen below:


The total transactions increased dramatically from 11/2016 to 03/2017, as shown in the bar chart below.

The top 10 items sold are described in the chart below. Coffee, bread, and tea are the most popular items in the bakery.

Now, let’s look into how we can apply the association rule mining to this data.
Because items in a transaction are split into different rows, I will group those items into a place. A list of lists of items is converted as below:

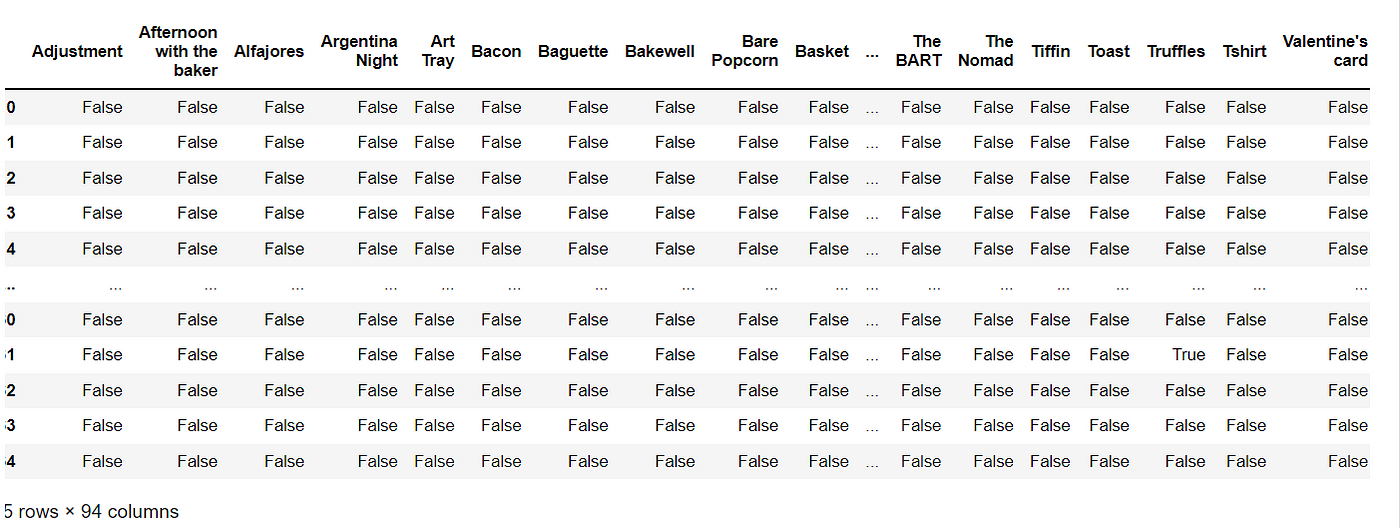
The Apriori module requires a data frame with values of 0 and 1 or True and False. Therefore, I will use One Hot Encode the data to meet the requirement of the Apriori module given by mlxtend library.
Before applying the Apriori module, we need to import some necessary libraries:
Now, we can easily apply the apriori module from mlxtend library. The frequent sets are found with just one line of code. In this example, I will use the min_support = 0.05 , which implies the minimum support required for an itemset to be chosen. Meanwhile,use_colnames = True keeps column names for itemsets to make them more understandable.

From these frequent sets, I continue to find the association rules which determine if A is bought, then B is also purchased. I set the metric = 'lift' with the minimum threshold = 1.

As we can see, the results consist of two association rules only. Cake and Coffee are bought more frequently than random with the lift = 1.1 and 53% confidence.

Although the Apriori algorithm is simple to apply, it still has certain constraints, which include:
- The algorithm’s efficiency will be reduced if the number of transactions is large and there is a restricted memory capacity.
- As it needs to scan the whole database, high processing power is required
Knowing the technique of association rules mining will help understand the customers better and therefore have suitable strategies to boost sales. Some benefits that can be withdrawn from the method can be mentioned as follows:
- Booth arrangement: You may group related goods together. Price combo items based on consumer purchasing habits.
- Product recommendations: Product recommendations should be based on user purchasing habits. You may give clients discounts if they buy more combinations. Alternatively, customers may purchase additional goods with a minimum total price.
- Inventory Management: Market basket analysis becomes the basis for forecasting future purchases. Besides, sales data is captured concurrently, so maintaining product supply and controlling inventory becomes more efficient.
- Optimize Ads Cost: Make the most of your advertising opportunities. Customers’ reactions to messaging, communications, and offers reflect this.
I hope my article will be a good foundation for those who want to know more about this helpful method to understand customer behaviors better.
Understanding the customer behaviors through concepts, the working mechanism of Association Rules Mining, and Python code
You must have noticed that the seller at the Pizza store makes a combo of pizza, soft drinks, and chips. He also gives discounts to their customers who buy these combos. Have you ever wondered why he would do that?
It’s because he discovers customers who buy pizza also buy soft drinks and chips. By doing combos, he made it easy for customers. At the same time, he also increased his sales performance.
From the above small example, there is no denying the importance of collecting and analyzing user behavior to create effective cross-sell and upsell strategies in sales. Based on data on user behaviors, we may use RFM and cluster analysis to divide customers into different groups to have customized service care for each group. However, to predict other products customers may buy, one of the methods that analysts often use to understand the customer purchasing habit is association rule mining.
In today’s article, I will give you the most overview information about this technique and how to use it to understand customers better.
Based on the transaction history, many patterns can be exploited to understand customer behaviors. One of the insights that can be achieved is the associations between items purchased. Using the data of all items bought, we can determine which items are usually purchased or purchased together, thereby defining and building up product association models. Conclusions must be tested for probability and reliability. For example, a person goes to a supermarket to buy bread. It is an 80% chance that he/she might purchase jam or ham to eat with bread with 90% confidence.
Then, retailers may use the analytical results to position, recommend, and navigate products in a store, to promote cross-selling between products or product categories.
Apriori is an algorithm that exploits sets of objects in data related to each other. In other words, it helps identify frequently occurring item sets. Let’s talk about apriori with a minimum occurrence threshold of one. The procedure begins with finding individual objects that meet a minimal occurrence requirement. It then expands the item set one item at a time, checking to see if the more extensive item set still meets the pre-defined threshold. The algorithm terminates when there are no more items to add that fulfill the minimum occurrence condition.
Assuming that we have 4 orders, each order is described as follows:
In these 4 orders, we have 3 orders that include apples, 3 that include bananas, and 2 that include bananas and apples. Using this information, I will calculate some crucial metrics of Apriori, including Support, Confidence, and Lift.
Support
This is the proportion of orders that include the item set. As you can see in the above example, 3 orders include bananas in a total of 4 orders, therefore:
Support (bananas)
= Bananas related orders/Total orders
= 3/4 = 0.75
Confidence
In this example, confidence expresses the percentage of times apples are purchased after bananas have been purchased. So, the formula can be shown below:
Confidence (bananas -> apples)
= support (bananas, apples) / support (bananas)
=(2/4)/(3/4) = 0.6667
The value of 66.67% means that 66.67% of customers who buy bananas also purchase apples. However, does this number suggest a relationship between these two fruits, or are they merely purchasing together by chance? To answer this question, we will have to look at another metric that considers the popularity of both things.
The support and confidence thresholds are set differently depending on business purposes, research contexts, and industry domains. For example, when analyzing financial fraud, the support value might be 1% as there will be relatively few transactions that exhibit fraud in the data set. Therefore, there is no specific standard for deciding a particular threshold.
Lift
This metric shows if there is actually an association between items or if the purchase of these items is just a random combination. From the example, we can quickly compute lift as:
Lift(bananas, apples) = Lift(apples, bananas)
= support(bananas, apples) / (support(bananas) * support(apples))
=(2/4)/(0.75*0.75) = 0.89
So, the measure implies that if bananas appear in 75% of the orders, apples appear in 75% of the orders, and there is no link between these 2 items, apples and bananas are expected to be bought together 75% * 75% = 56.25% of the time. Meanwhile, the numerator reflects the frequency with which apples and bananas come together in the same order. That is 50% of the time in this scenario. Getting this value and dividing by 56.25% shows how many more times apples and bananas appear in the same order than if they have no association.
Based on the result of lift values, we can have some inferences:
- lift = 1: items are randomly bought together. In other words, there is no relationship between items.
- lift > 1: items are purchased together more frequently than random.
- lift < 1: items are bought together less regularly than random.
In the example above, apples and bananas appear together 0.89 times more than random. Therefore, we can tell there is a negative relationship between these 2 items.
Now, let’s see how the association rules mining works in a real dataset.
For this article, I will use a dataset from a bakery (License: CC0: Public Domain). This dataset includes 20507 entries, over 9000 transactions, and 5 columns. You can download the data from this link.
The overview of the dataset can be seen below:
The total transactions increased dramatically from 11/2016 to 03/2017, as shown in the bar chart below.
The top 10 items sold are described in the chart below. Coffee, bread, and tea are the most popular items in the bakery.
Now, let’s look into how we can apply the association rule mining to this data.
Because items in a transaction are split into different rows, I will group those items into a place. A list of lists of items is converted as below:
The Apriori module requires a data frame with values of 0 and 1 or True and False. Therefore, I will use One Hot Encode the data to meet the requirement of the Apriori module given by mlxtend library.
Before applying the Apriori module, we need to import some necessary libraries:
Now, we can easily apply the apriori module from mlxtend library. The frequent sets are found with just one line of code. In this example, I will use the min_support = 0.05 , which implies the minimum support required for an itemset to be chosen. Meanwhile,use_colnames = True keeps column names for itemsets to make them more understandable.
From these frequent sets, I continue to find the association rules which determine if A is bought, then B is also purchased. I set the metric = 'lift' with the minimum threshold = 1.
As we can see, the results consist of two association rules only. Cake and Coffee are bought more frequently than random with the lift = 1.1 and 53% confidence.
Although the Apriori algorithm is simple to apply, it still has certain constraints, which include:
- The algorithm’s efficiency will be reduced if the number of transactions is large and there is a restricted memory capacity.
- As it needs to scan the whole database, high processing power is required
Knowing the technique of association rules mining will help understand the customers better and therefore have suitable strategies to boost sales. Some benefits that can be withdrawn from the method can be mentioned as follows:
- Booth arrangement: You may group related goods together. Price combo items based on consumer purchasing habits.
- Product recommendations: Product recommendations should be based on user purchasing habits. You may give clients discounts if they buy more combinations. Alternatively, customers may purchase additional goods with a minimum total price.
- Inventory Management: Market basket analysis becomes the basis for forecasting future purchases. Besides, sales data is captured concurrently, so maintaining product supply and controlling inventory becomes more efficient.
- Optimize Ads Cost: Make the most of your advertising opportunities. Customers’ reactions to messaging, communications, and offers reflect this.
I hope my article will be a good foundation for those who want to know more about this helpful method to understand customer behaviors better.
Denial of responsibility! Techno Blender is an automatic aggregator of the all world’s media. In each content, the hyperlink to the primary source is specified. All trademarks belong to their rightful owners, all materials to their authors. If you are the owner of the content and do not want us to publish your materials, please contact us by email – [email protected]. The content will be deleted within 24 hours.