
Statistical Method scDEED Detects Dubious t-SNE and UMAP Embeddings and Optimizes Hyperparameters
scDEED assigns a reliability score to each 2D embedding to indicate how much the data point’s mid-range neighbors change in the 2D space
The article was co-authored with Christy Lee, Ph.D. student of Statistics at UCLA.
t-SNE (t-Distributed Stochastic Neighbor Embedding) and UMAP (Uniform Manifold Approximation and Projection) are non-linear dimensionality reduction techniques for visualizing high-dimensional data, particularly in the context of single-cell analysis for visualizing cell clusters. However, it is important to note that t-SNE and UMAP may not always produce trustworthy representations of the relative distances between cell clusters.
In our Nature Communications paper [1], we provide a framework for (1) identifying data distortions in projection from a high-dimensional to two-dimensional (2D) space and (2) optimizing hyperparameter settings in a 2D dimension-reduction method.
Consider a 3-dimensional (3D) globe vs a 2-dimensional (2D) map. It is impossible to represent an entire globe accurately in only 2D; distance may not be accurate, and the size of some countries may be distorted. Typically, land masses at the edge of the map, like Antarctica, are the most changed. Despite these distortions, 2D maps are useful for everyday use; students or the common traveler to the main continents will not be affected by the distortion in Antarctica, but an intrepid traveler to the poles will certainly require a different map.
Similarly, the representation of single-cell genomics data often requires moving from a high-dimensional to 2D space, so-called 2D embedding. As with the conversion of the globe, this can induce distortions. The 2D post-embedding space may not accurately represent the pre-embedding space. Adding to the problem, popular 2D embedding methods, like t-SNE and UMAP, are sensitive to hyperparameter selection. While general guidelines exist to tailor hyperparameters like perplexity and n.neighbors to the size of the dataset, these guidelines do not help answer the underlying question– what parts of the visualization are misleading?
Similar to cartographers selecting which landmasses to recreate faithfully and which to distort, researchers must prioritize which aspects of the pre-embedding space are most important to preserve post-embedding. Common uses of 2D visualization include annotation and analysis of cell trajectories and clusters. Although cell trajectories and clusters are generally calculated in the high-dimensional space, their results are often visualized through 2D embeddings, in which cells with similar gene expression are expected to be close to each other. Therefore, we concluded that the most important aspect of preservation is the position of cells relative to each other.
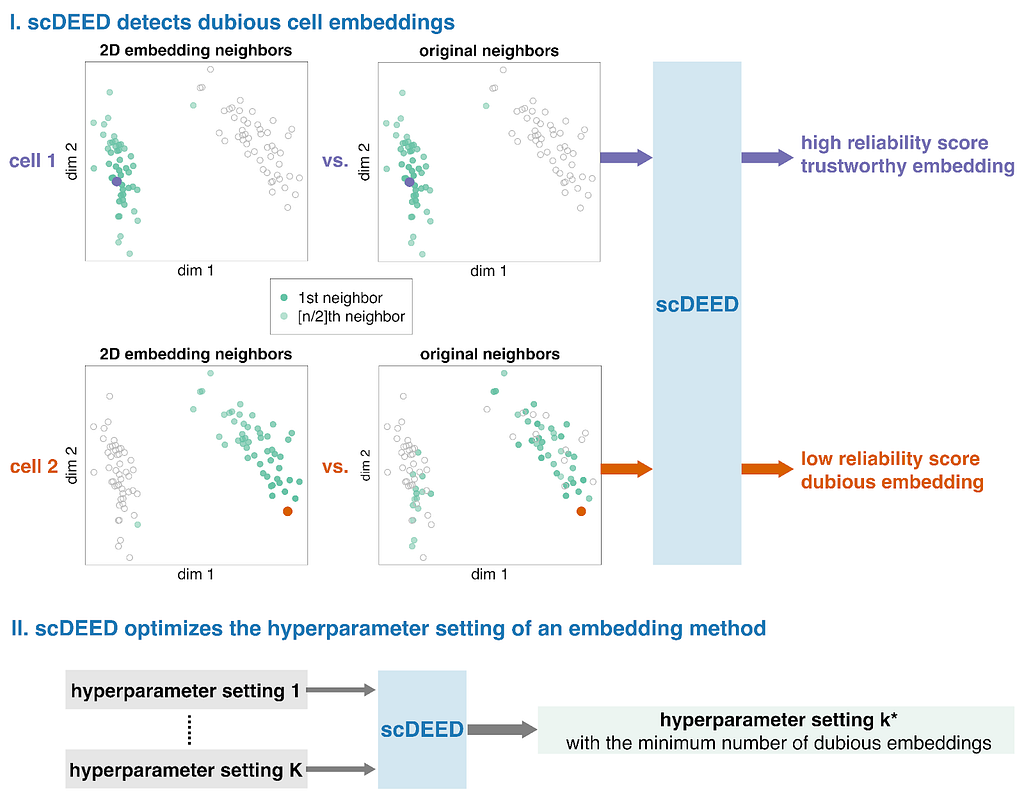
These ideas formed the motivation for scDEED, a single-cell dubious embedding detector (Fig. 1). The key idea is that a cell’s pre- and post-embedding neighbors should be similar. It is worth noting that the pre-embedding space is typically 20- to 50-dimensional in single-cell data analysis, usually the principal component space. For each cell, we calculate a reliability score that reflects the visual agreement between the neighbors found in the 2D-embedding space and the pre-embedding space. Cells whose 2D embedding neighbors have been drastically changed through the embedding process are called ‘dubious’; the cell’s relative location is misleading and does not reflect where the cell should be based on the pre-embedding space. Identification of these cells provides a mechanism to optimize hyperparameters by selecting the settings that result in the least amount of dubious cell embeddings.
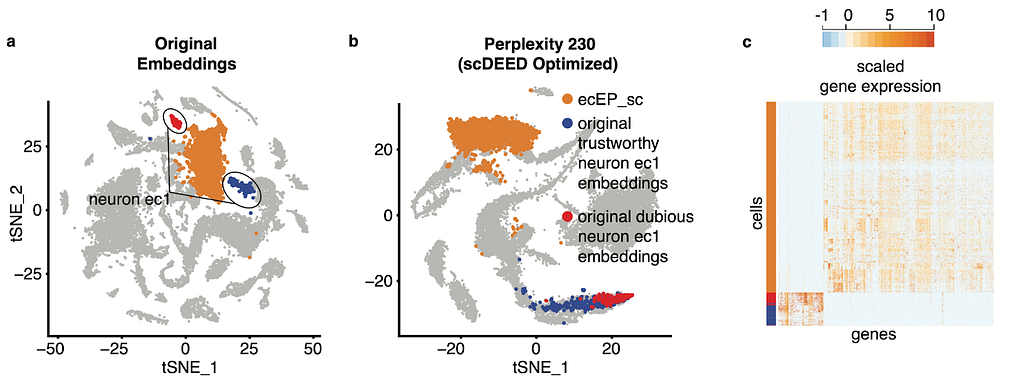
In our paper [1], we use a variety of datasets to show how the identification of dubious cells and optimization of hyperparameters can aid analysis. For example, in the original visualization of the single-cell RNA-seq Hydra dataset [2], the neuron ectodermal 1 (neuron ec1) cells are split into two clusters, one that scDEED marked as dubious and the other trustworthy (Fig. 2a). As confirmed by the similarity in gene expression (Fig. 2c) and the singular cell type assigned by the authors, these two clusters are not biologically distinct, making their separation in the t-SNE misleading. Further, if we compare the neuron ec1 cells to its neighboring clusters, like the highlighted ectodermal epithelial cells (ecEP_sc), the gene expression is very different, which is counterintuitive given their proximity in the visualization. However, under the optimized perplexity found by scDEED (Fig. 2b), the neuron ec1 cell type is now unified, further supporting that the original split of the cell type into clusters was a result of hyperparameter settings. Additionally, the neuron ec1 and ecEP_sc cells are now far apart, which is more appropriate given their differences in gene expression. This highlights two uses for scDEED: identification of dubious cells can help discern cells whose embedding positions are misleading, and optimization of hyperparameters can result in a more trustworthy visualization.
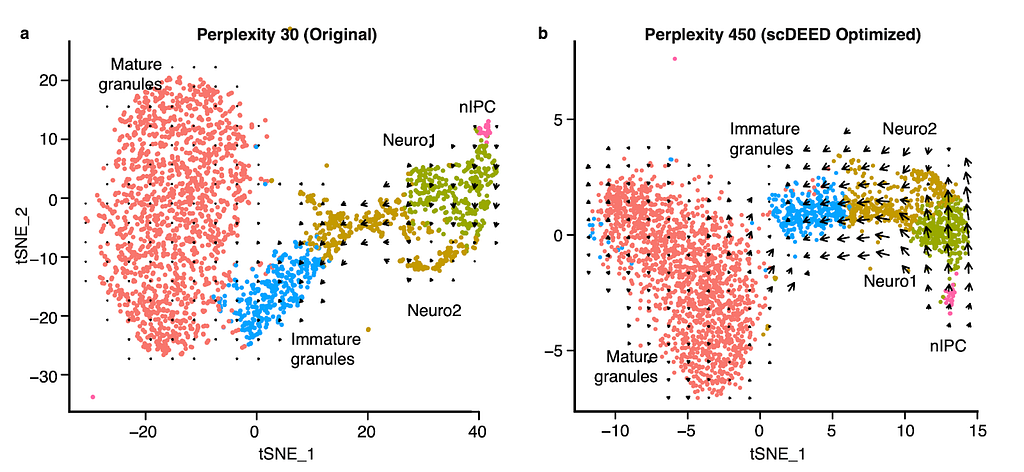
An interesting application is RNA velocity [3], a downstream analysis task that relies on visualization. RNA velocity uses the amount of unspliced and spliced mRNA to estimate gene velocity– the change in gene expression. The estimated gene velocity can be used to calculate predicted gene expression for a future time point, which can be visualized with an arrow from the cell to the cell’s predicted state. For large datasets, it is not reasonable to plot each cell’s velocity vector; rather, cells are grouped based on their 2D embeddings, and their velocity vectors are aggregated. Changes to the 2D embedding will not affect the estimated gene velocities or predicted expression for the individual cells, but it will change the cell grouping for vector field calculations, and therefore affect the visualized RNA velocities and analysis. Using scDEED to optimize the hyperparameter perplexity of t-SNE (Fig. 3a) greatly enhanced the agreement among neighboring cells, and provided clearer RNA velocity results than using the default hyperparameter value (Fig. 3b). Additionally, the vectors are not exaggerated for the mature granules, an expected result because the cells are fully differentiated. Optimization of the hyperparameter enhanced only existing cell trajectories.
Recent work [5,6] has highlighted geometric qualities, like geodesics, manifolds, and distance, that cannot be fully recreated because the pre- and post-embedding spaces are not homeomorphic. scDEED can help reduce the inconsistencies by finding hyperparameter settings that accurately capture mid-range cell-cell relationships for the most number of possible cells and identifying cells whose mid-range neighbors have drastically changed. We hope that scDEED can be used as an add-on to existing analysis pipelines to provide a more trustworthy 2D visualization. It is worth pointing out that scDEED does not measure the preservation of all aspects of data; as cartographers deemed it most important to preserve the 5 main continents, we chose to prioritize the relative location of cells. With some adjustments to the definition of the reliability score (one per cell embedding), researchers interested in preserving other qualities of the pre-embedding space may still find the framework of scDEED useful.
References
1. Xia L, Lee C, Li JJ. Statistical method scDEED for detecting dubious 2D single-cell embeddings and optimizing t-SNE and UMAP hyperparameters. Nat Commun. 2024;15: 1753. doi:10.1038/s41467-024-45891-y
2. Siebert S, Farrell JA, Cazet JF, Abeykoon Y, Primack AS, Schnitzler CE, et al. Stem cell differentiation trajectories in Hydra resolved at single-cell resolution. Science. 2019;365. doi:10.1126/science.aav9314
3. La Manno G, Soldatov R, Zeisel A, Braun E, Hochgerner H, Petukhov V, et al. RNA velocity of single cells. Nature. 2018;560: 494–498.
4. Hochgerner H, Zeisel A, Lönnerberg P, Linnarsson S. Conserved properties of dentate gyrus neurogenesis across postnatal development revealed by single-cell RNA sequencing. Nat Neurosci. 2018;21: 290–299.
5. Wang S, Sontag ED, Lauffenburger DA. What cannot be seen correctly in 2D visualizations of single-cell ’omics data? Cell Syst. 2023;14: 723–731.
6. Chari T, Pachter L. The specious art of single-cell genomics. PLoS Comput Biol. 2023;19: e1011288.
Statistical Method scDEED Detects Dubious t-SNE and UMAP Embeddings and Optimizes Hyperparameters was originally published in Towards Data Science on Medium, where people are continuing the conversation by highlighting and responding to this story.
scDEED assigns a reliability score to each 2D embedding to indicate how much the data point’s mid-range neighbors change in the 2D space
The article was co-authored with Christy Lee, Ph.D. student of Statistics at UCLA.

t-SNE (t-Distributed Stochastic Neighbor Embedding) and UMAP (Uniform Manifold Approximation and Projection) are non-linear dimensionality reduction techniques for visualizing high-dimensional data, particularly in the context of single-cell analysis for visualizing cell clusters. However, it is important to note that t-SNE and UMAP may not always produce trustworthy representations of the relative distances between cell clusters.
In our Nature Communications paper [1], we provide a framework for (1) identifying data distortions in projection from a high-dimensional to two-dimensional (2D) space and (2) optimizing hyperparameter settings in a 2D dimension-reduction method.
Consider a 3-dimensional (3D) globe vs a 2-dimensional (2D) map. It is impossible to represent an entire globe accurately in only 2D; distance may not be accurate, and the size of some countries may be distorted. Typically, land masses at the edge of the map, like Antarctica, are the most changed. Despite these distortions, 2D maps are useful for everyday use; students or the common traveler to the main continents will not be affected by the distortion in Antarctica, but an intrepid traveler to the poles will certainly require a different map.
Similarly, the representation of single-cell genomics data often requires moving from a high-dimensional to 2D space, so-called 2D embedding. As with the conversion of the globe, this can induce distortions. The 2D post-embedding space may not accurately represent the pre-embedding space. Adding to the problem, popular 2D embedding methods, like t-SNE and UMAP, are sensitive to hyperparameter selection. While general guidelines exist to tailor hyperparameters like perplexity and n.neighbors to the size of the dataset, these guidelines do not help answer the underlying question– what parts of the visualization are misleading?
Similar to cartographers selecting which landmasses to recreate faithfully and which to distort, researchers must prioritize which aspects of the pre-embedding space are most important to preserve post-embedding. Common uses of 2D visualization include annotation and analysis of cell trajectories and clusters. Although cell trajectories and clusters are generally calculated in the high-dimensional space, their results are often visualized through 2D embeddings, in which cells with similar gene expression are expected to be close to each other. Therefore, we concluded that the most important aspect of preservation is the position of cells relative to each other.
These ideas formed the motivation for scDEED, a single-cell dubious embedding detector (Fig. 1). The key idea is that a cell’s pre- and post-embedding neighbors should be similar. It is worth noting that the pre-embedding space is typically 20- to 50-dimensional in single-cell data analysis, usually the principal component space. For each cell, we calculate a reliability score that reflects the visual agreement between the neighbors found in the 2D-embedding space and the pre-embedding space. Cells whose 2D embedding neighbors have been drastically changed through the embedding process are called ‘dubious’; the cell’s relative location is misleading and does not reflect where the cell should be based on the pre-embedding space. Identification of these cells provides a mechanism to optimize hyperparameters by selecting the settings that result in the least amount of dubious cell embeddings.
In our paper [1], we use a variety of datasets to show how the identification of dubious cells and optimization of hyperparameters can aid analysis. For example, in the original visualization of the single-cell RNA-seq Hydra dataset [2], the neuron ectodermal 1 (neuron ec1) cells are split into two clusters, one that scDEED marked as dubious and the other trustworthy (Fig. 2a). As confirmed by the similarity in gene expression (Fig. 2c) and the singular cell type assigned by the authors, these two clusters are not biologically distinct, making their separation in the t-SNE misleading. Further, if we compare the neuron ec1 cells to its neighboring clusters, like the highlighted ectodermal epithelial cells (ecEP_sc), the gene expression is very different, which is counterintuitive given their proximity in the visualization. However, under the optimized perplexity found by scDEED (Fig. 2b), the neuron ec1 cell type is now unified, further supporting that the original split of the cell type into clusters was a result of hyperparameter settings. Additionally, the neuron ec1 and ecEP_sc cells are now far apart, which is more appropriate given their differences in gene expression. This highlights two uses for scDEED: identification of dubious cells can help discern cells whose embedding positions are misleading, and optimization of hyperparameters can result in a more trustworthy visualization.
An interesting application is RNA velocity [3], a downstream analysis task that relies on visualization. RNA velocity uses the amount of unspliced and spliced mRNA to estimate gene velocity– the change in gene expression. The estimated gene velocity can be used to calculate predicted gene expression for a future time point, which can be visualized with an arrow from the cell to the cell’s predicted state. For large datasets, it is not reasonable to plot each cell’s velocity vector; rather, cells are grouped based on their 2D embeddings, and their velocity vectors are aggregated. Changes to the 2D embedding will not affect the estimated gene velocities or predicted expression for the individual cells, but it will change the cell grouping for vector field calculations, and therefore affect the visualized RNA velocities and analysis. Using scDEED to optimize the hyperparameter perplexity of t-SNE (Fig. 3a) greatly enhanced the agreement among neighboring cells, and provided clearer RNA velocity results than using the default hyperparameter value (Fig. 3b). Additionally, the vectors are not exaggerated for the mature granules, an expected result because the cells are fully differentiated. Optimization of the hyperparameter enhanced only existing cell trajectories.
Recent work [5,6] has highlighted geometric qualities, like geodesics, manifolds, and distance, that cannot be fully recreated because the pre- and post-embedding spaces are not homeomorphic. scDEED can help reduce the inconsistencies by finding hyperparameter settings that accurately capture mid-range cell-cell relationships for the most number of possible cells and identifying cells whose mid-range neighbors have drastically changed. We hope that scDEED can be used as an add-on to existing analysis pipelines to provide a more trustworthy 2D visualization. It is worth pointing out that scDEED does not measure the preservation of all aspects of data; as cartographers deemed it most important to preserve the 5 main continents, we chose to prioritize the relative location of cells. With some adjustments to the definition of the reliability score (one per cell embedding), researchers interested in preserving other qualities of the pre-embedding space may still find the framework of scDEED useful.
References
1. Xia L, Lee C, Li JJ. Statistical method scDEED for detecting dubious 2D single-cell embeddings and optimizing t-SNE and UMAP hyperparameters. Nat Commun. 2024;15: 1753. doi:10.1038/s41467-024-45891-y
2. Siebert S, Farrell JA, Cazet JF, Abeykoon Y, Primack AS, Schnitzler CE, et al. Stem cell differentiation trajectories in Hydra resolved at single-cell resolution. Science. 2019;365. doi:10.1126/science.aav9314
3. La Manno G, Soldatov R, Zeisel A, Braun E, Hochgerner H, Petukhov V, et al. RNA velocity of single cells. Nature. 2018;560: 494–498.
4. Hochgerner H, Zeisel A, Lönnerberg P, Linnarsson S. Conserved properties of dentate gyrus neurogenesis across postnatal development revealed by single-cell RNA sequencing. Nat Neurosci. 2018;21: 290–299.
5. Wang S, Sontag ED, Lauffenburger DA. What cannot be seen correctly in 2D visualizations of single-cell ’omics data? Cell Syst. 2023;14: 723–731.
6. Chari T, Pachter L. The specious art of single-cell genomics. PLoS Comput Biol. 2023;19: e1011288.
Statistical Method scDEED Detects Dubious t-SNE and UMAP Embeddings and Optimizes Hyperparameters was originally published in Towards Data Science on Medium, where people are continuing the conversation by highlighting and responding to this story.
Denial of responsibility! Techno Blender is an automatic aggregator of the all world’s media. In each content, the hyperlink to the primary source is specified. All trademarks belong to their rightful owners, all materials to their authors. If you are the owner of the content and do not want us to publish your materials, please contact us by email – [email protected]. The content will be deleted within 24 hours.