
The 5-Step Data Science Project Life Cycle You Need to Be an Effective Data Scientist | by Madison Hunter | Oct, 2022
These 5 core steps can be used to plan any data science project
If you’re anything like me, checklists and processes are your lifelines. Not only do they keep you organized but they also help you foresee and mitigate issues that could come down the pipe as a project progresses.
Coming from a software development educational background, I knew the “software development lifecycle” (SDLC) by heart and I prepared many checklists for myself to ensure that I was always writing the best code possible (see: This Quick and Easy 7-Step Checklist Will Help You Write Better Python Code for Data Science).
However, as I began working my way through the numerous data science courses and certificates available online, I noticed that one important thing was missing: any mention of a project lifecycle. It wasn’t until I did my own digging that I learned that data science does have a general lifecycle and that it’s flexible enough to be modified to suit the needs of each team or project.
There are a few reasons why it’s a good idea to be familiar with the data science project lifecycle. First, it makes you an effective team member and data scientist. A project only comes together when each member of a team is working in unison, or when an individual has checked off all the boxes to create a cohesive project. Second, you could get an interview question about the lifecycle of data science projects, and your answer could give the recruiter a good idea of how you would fit into the role. Finally, and perhaps it doesn’t need to be said, the data science project lifecycle helps guide your data science projects. It provides a step-by-step set of milestones that will help you plan and execute a well-rounded project and will also help you prepare for and mitigate any potential issues that could arise further down the line.
It’s important to first note that the data science lifecycle may look a little different to everyone. There are a few different interpretations, although they all generally resemble the following structure:
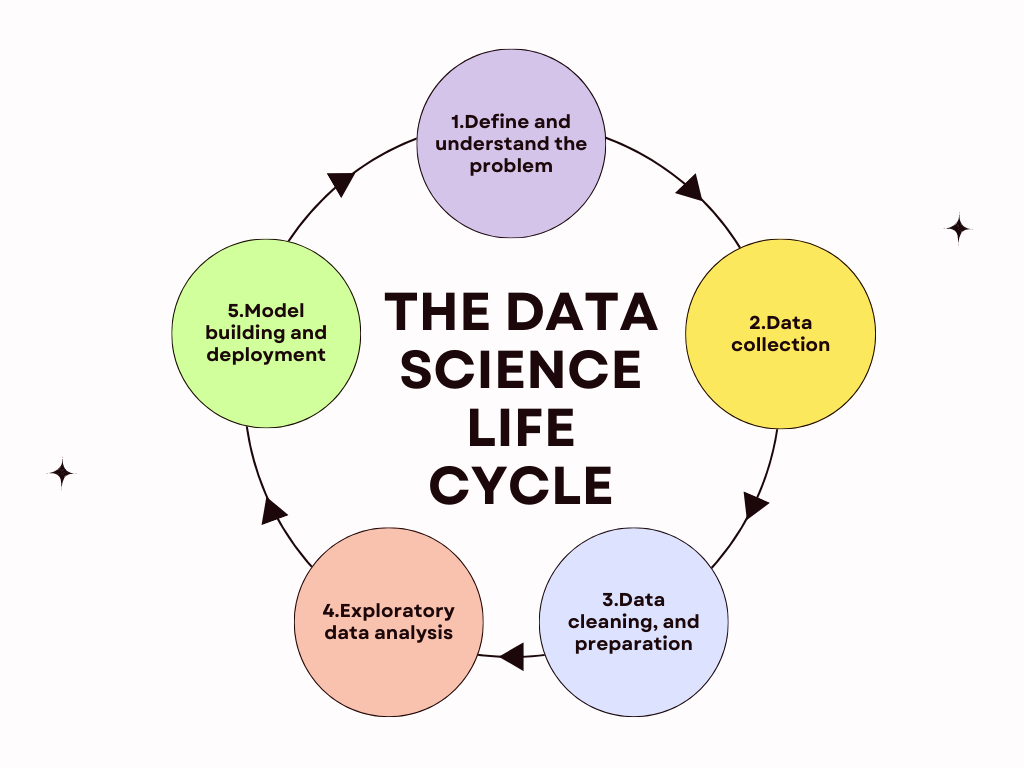
1. Define and understand the problem
A problem cannot be solved if you don’t know what the problem is.
Plenty of executives will go to their data science team claiming that there’s a problem and that the data science team needs to solve it, yet will have no idea how to articulate the problem, why it needs to be solved, and what the connection is between the business case and the technical case.
The first step is to produce a clear definition and understanding of the problem or business case and then translate that into a data science problem with actionable steps and goals. This involves clear, concise communication with the business executives and asking enough questions that no contradictory results can be produced. Solving a problem with data takes a lot of work, so you might as well do it right the first time.
One of the key questions that executives should be asked is how solving the problem will benefit the company (or its customers) and how the problem fits into the other processes of the company. Not only does this help you and your team determine which data sets will be pulled, but also the types of analyses you’ll run and the answers you’ll be looking for.
2. Data collection
If you’ve asked the right questions and have a clear idea of the problem you’re trying to solve, you should be well-prepared to collect the right data for the job.
I say that you should be well-prepared, but data collection can turn up all sorts of problems. Not all companies maintain excellent data sets, nor do all companies necessarily have the right data for the job. More time than you think should be spent on this step to ensure that you have the right data from the beginning — again, these projects take a lot of time and effort so you might as well do it right the first time.
Additionally, it’s always a good idea to collect more data than you think you’ll need. Data sets may be incomplete or erroneous for other reasons, so it’s always a good idea to have extra data just in case. That way, your entire project can still be completed regardless of the quality of the data. This will just require that you go through the data with an extra-fine-toothed comb to ensure that you’re only using the best data for the project.
3. Data cleaning and preparation
As I described in the previous step, collecting more data than you think you’ll need is always valuable once you start combing through the raw data with a fine-toothed comb to pick out incomplete or erroneous entries.
The reoccurring theme of this process is that you must do each step right the first time to reduce the potential of having to do it all over again. Data science is all about working smart, not hard. This means that in order to produce the right models in step five of the process, you need to properly clean and prepare the data you plan on using. It’s vital to remember that your models will potentially change the way your company does business which means that you need to be right the first time when developing your models.
Some of the key types of erroneous data you need to be aware of include incorrectly formatted data, corrupted data, duplicate or null values, extreme outliers, and even missing data.
This is the longest step in the data science project lifecycle, and many data scientists will argue that it makes up the majority of the time spent on a project. The adage that 20% of your results come from 80% of your work rings true here. However, bad data produces bad models, which means that you must spend the time now instead of having to fix your mistakes later.
4. Exploratory data analysis
This is arguably the first “fun” step in the data science project lifecycle as you finally get to write some code and see what all of the data you’ve painstakingly cleaned is trying to tell you.
Exploratory data analysis is used to summarize the main characteristics of a data set and is often completed by developing data visualizations. These visualizations will help you quickly see patterns and spot anomalies in the data. Now is also the time for you to carry out hypothesis testing or check any assumptions that you may have or that may have been brought up during your initial discussions with company executives. What you discover during this stage will help you develop models later on that are devoid of assumptions or erroneous insights.
Some of the tools you may find yourself using during your exploratory data analysis are clustering and dimension reduction techniques, univariate visualization, bivariate visualizations and summary statistics, multivariate visualizations, K-means Clustering, or linear regressions.
It’s important to note that this may be the final stage of your project depending on the business problem you’ve been tasked to solve. If the initial question was a simple one of confidence intervals or standard deviations, your project will be complete with the generation of a couple of visualizations that will help executives understand. However, if the question is more predictive in nature, you’ll move on to the final step in the cycle: model building and deployment.
5. Model building and deployment
You’ve now reached the second and final “fun” step of the data science project lifecycle. Now is the time to split your data set into train and test sets that will be used to develop your machine learning models.
Here is where you’ll determine whether you need to create a supervised or unsupervised machine learning model. Supervised models are used to classify unseen data and forecast future trends and outcomes by “learning” patterns in the training data. Unsupervised models are used to find similarities within data, understand relationships between different data points within a set, and perform additional data analyses. For example, supervised models may be used to protect a company from spam, or to forecast changes in markets. Unsupervised models may be used to segment clients into marketing environments or recommend products and services to customers based on their previous purchases.
Your models may need a few tweaks here and there, but if you’ve done all of the previous steps correctly, there shouldn’t be any major changes necessary.
Once you’ve built a model that you’re satisfied with, it will then be deployed into the production environment. While it’s likely that your company’s software development team will likely handle the majority of the deployment, here are a few tips on how you can make the process easier for them:
These 5 core steps can be used to plan any data science project
If you’re anything like me, checklists and processes are your lifelines. Not only do they keep you organized but they also help you foresee and mitigate issues that could come down the pipe as a project progresses.
Coming from a software development educational background, I knew the “software development lifecycle” (SDLC) by heart and I prepared many checklists for myself to ensure that I was always writing the best code possible (see: This Quick and Easy 7-Step Checklist Will Help You Write Better Python Code for Data Science).
However, as I began working my way through the numerous data science courses and certificates available online, I noticed that one important thing was missing: any mention of a project lifecycle. It wasn’t until I did my own digging that I learned that data science does have a general lifecycle and that it’s flexible enough to be modified to suit the needs of each team or project.
There are a few reasons why it’s a good idea to be familiar with the data science project lifecycle. First, it makes you an effective team member and data scientist. A project only comes together when each member of a team is working in unison, or when an individual has checked off all the boxes to create a cohesive project. Second, you could get an interview question about the lifecycle of data science projects, and your answer could give the recruiter a good idea of how you would fit into the role. Finally, and perhaps it doesn’t need to be said, the data science project lifecycle helps guide your data science projects. It provides a step-by-step set of milestones that will help you plan and execute a well-rounded project and will also help you prepare for and mitigate any potential issues that could arise further down the line.
It’s important to first note that the data science lifecycle may look a little different to everyone. There are a few different interpretations, although they all generally resemble the following structure:
1. Define and understand the problem
A problem cannot be solved if you don’t know what the problem is.
Plenty of executives will go to their data science team claiming that there’s a problem and that the data science team needs to solve it, yet will have no idea how to articulate the problem, why it needs to be solved, and what the connection is between the business case and the technical case.
The first step is to produce a clear definition and understanding of the problem or business case and then translate that into a data science problem with actionable steps and goals. This involves clear, concise communication with the business executives and asking enough questions that no contradictory results can be produced. Solving a problem with data takes a lot of work, so you might as well do it right the first time.
One of the key questions that executives should be asked is how solving the problem will benefit the company (or its customers) and how the problem fits into the other processes of the company. Not only does this help you and your team determine which data sets will be pulled, but also the types of analyses you’ll run and the answers you’ll be looking for.
2. Data collection
If you’ve asked the right questions and have a clear idea of the problem you’re trying to solve, you should be well-prepared to collect the right data for the job.
I say that you should be well-prepared, but data collection can turn up all sorts of problems. Not all companies maintain excellent data sets, nor do all companies necessarily have the right data for the job. More time than you think should be spent on this step to ensure that you have the right data from the beginning — again, these projects take a lot of time and effort so you might as well do it right the first time.
Additionally, it’s always a good idea to collect more data than you think you’ll need. Data sets may be incomplete or erroneous for other reasons, so it’s always a good idea to have extra data just in case. That way, your entire project can still be completed regardless of the quality of the data. This will just require that you go through the data with an extra-fine-toothed comb to ensure that you’re only using the best data for the project.
3. Data cleaning and preparation
As I described in the previous step, collecting more data than you think you’ll need is always valuable once you start combing through the raw data with a fine-toothed comb to pick out incomplete or erroneous entries.
The reoccurring theme of this process is that you must do each step right the first time to reduce the potential of having to do it all over again. Data science is all about working smart, not hard. This means that in order to produce the right models in step five of the process, you need to properly clean and prepare the data you plan on using. It’s vital to remember that your models will potentially change the way your company does business which means that you need to be right the first time when developing your models.
Some of the key types of erroneous data you need to be aware of include incorrectly formatted data, corrupted data, duplicate or null values, extreme outliers, and even missing data.
This is the longest step in the data science project lifecycle, and many data scientists will argue that it makes up the majority of the time spent on a project. The adage that 20% of your results come from 80% of your work rings true here. However, bad data produces bad models, which means that you must spend the time now instead of having to fix your mistakes later.
4. Exploratory data analysis
This is arguably the first “fun” step in the data science project lifecycle as you finally get to write some code and see what all of the data you’ve painstakingly cleaned is trying to tell you.
Exploratory data analysis is used to summarize the main characteristics of a data set and is often completed by developing data visualizations. These visualizations will help you quickly see patterns and spot anomalies in the data. Now is also the time for you to carry out hypothesis testing or check any assumptions that you may have or that may have been brought up during your initial discussions with company executives. What you discover during this stage will help you develop models later on that are devoid of assumptions or erroneous insights.
Some of the tools you may find yourself using during your exploratory data analysis are clustering and dimension reduction techniques, univariate visualization, bivariate visualizations and summary statistics, multivariate visualizations, K-means Clustering, or linear regressions.
It’s important to note that this may be the final stage of your project depending on the business problem you’ve been tasked to solve. If the initial question was a simple one of confidence intervals or standard deviations, your project will be complete with the generation of a couple of visualizations that will help executives understand. However, if the question is more predictive in nature, you’ll move on to the final step in the cycle: model building and deployment.
5. Model building and deployment
You’ve now reached the second and final “fun” step of the data science project lifecycle. Now is the time to split your data set into train and test sets that will be used to develop your machine learning models.
Here is where you’ll determine whether you need to create a supervised or unsupervised machine learning model. Supervised models are used to classify unseen data and forecast future trends and outcomes by “learning” patterns in the training data. Unsupervised models are used to find similarities within data, understand relationships between different data points within a set, and perform additional data analyses. For example, supervised models may be used to protect a company from spam, or to forecast changes in markets. Unsupervised models may be used to segment clients into marketing environments or recommend products and services to customers based on their previous purchases.
Your models may need a few tweaks here and there, but if you’ve done all of the previous steps correctly, there shouldn’t be any major changes necessary.
Once you’ve built a model that you’re satisfied with, it will then be deployed into the production environment. While it’s likely that your company’s software development team will likely handle the majority of the deployment, here are a few tips on how you can make the process easier for them:
Denial of responsibility! Techno Blender is an automatic aggregator of the all world’s media. In each content, the hyperlink to the primary source is specified. All trademarks belong to their rightful owners, all materials to their authors. If you are the owner of the content and do not want us to publish your materials, please contact us by email – [email protected]. The content will be deleted within 24 hours.