The Function of Color in Data Viz: A Simple (but Complete) Guide | by Weronika Gawarska-Tywonek | Aug, 2022
USE COLOR MEANINGFULLY
Everything you need to know to create vivid charts
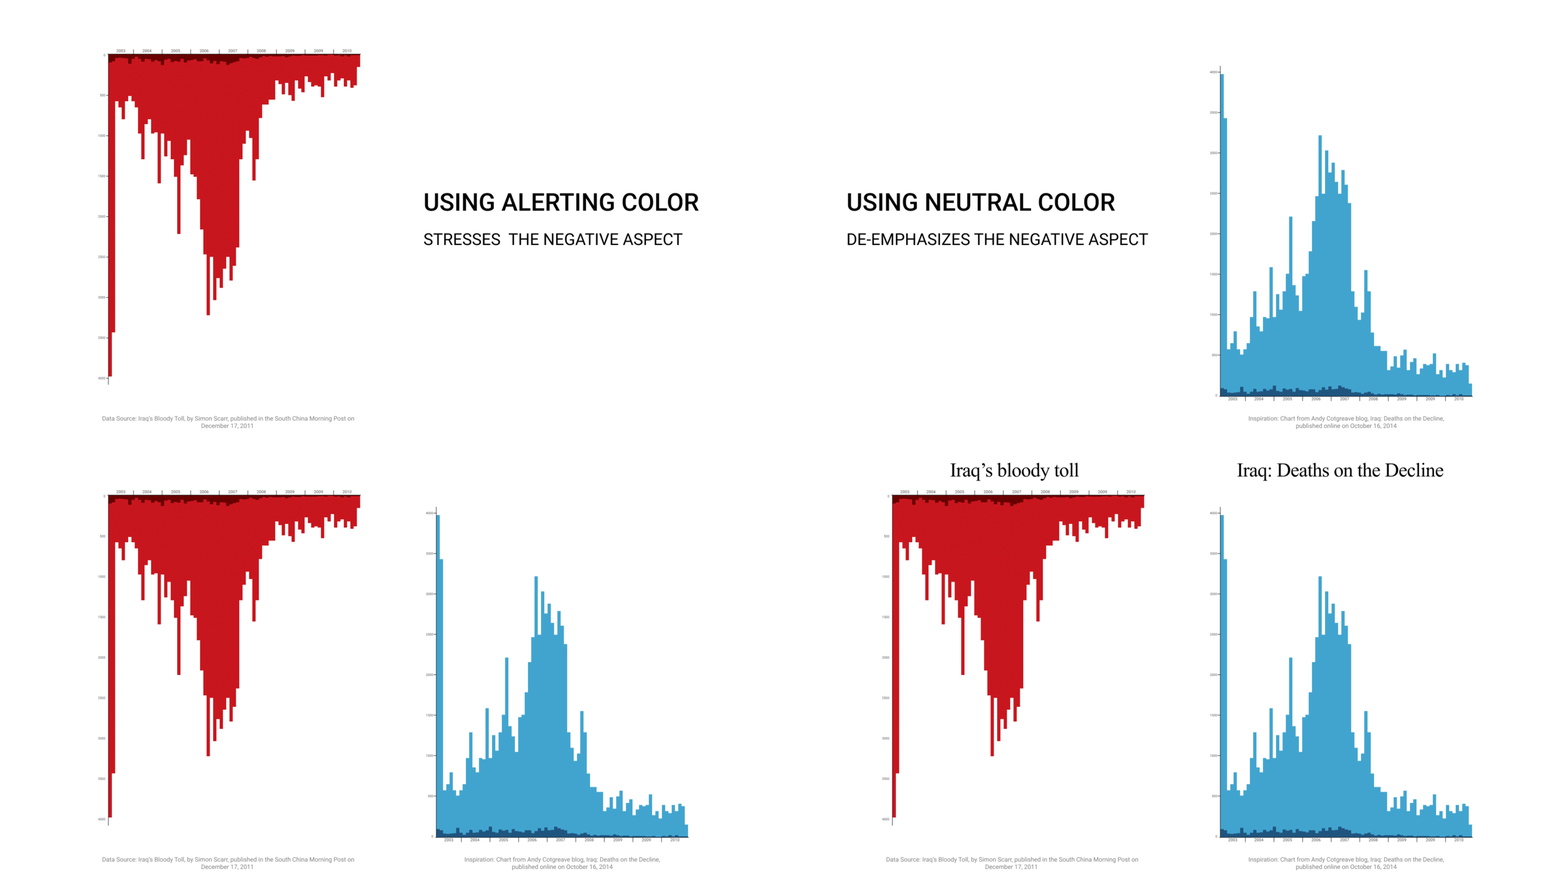
Color plays a significant role in any design, and data visualization is no different. On top of setting the tone, it often impacts our perception. Consider the following example. Without reading the title, what would you think if you saw the chart on the left (the red one)? And what would you think if you saw the chart on the right (the blue one)?

Both charts use the same data; in fact, they are mirror images. The first version is alerting — red bears a negative connotation, and it reminds us of the blood dripping from the wall. Looking at this version, you tend to focus on the extreme numbers. In comparison, the second version seems to deliver the opposite message. The blue color sets a more neutral, if not positive, tone, and you tend to focus on the recent decrease in numbers. In both cases, the message is strengthened by the suggestive title. But we get different insights and focus on various aspects because we perceive the color, even without seeing the title.
It happens because the color is one of the pre-attentive attributes, the visual features we detect instantly, without conscious processing. It affects our perception without us realizing it. The process is unconscious and driven by the culture and our previous experiences. Therefore it might vary among different people. Luckily, some guidelines help us use color carefully. I recommend checking the Color in Culture graph created by David McCandless.
As was already mentioned, you can use color to set the tone. Even though this function is important and worth mastering, I’d like to focus on three others that are sometimes overlooked: showing relations, showing different states, and displaying value.
All three start with recognizing the relationship between the data points and the color palette we should use. If you aren’t familiar with the color palettes and their usage, I recommend starting with my previous article dedicated to this topic [2]. If you know the difference between categorical, sequential, and diverging palettes, let’s analyze how we can incorporate them to show different functions of color using a standard bubble plot.
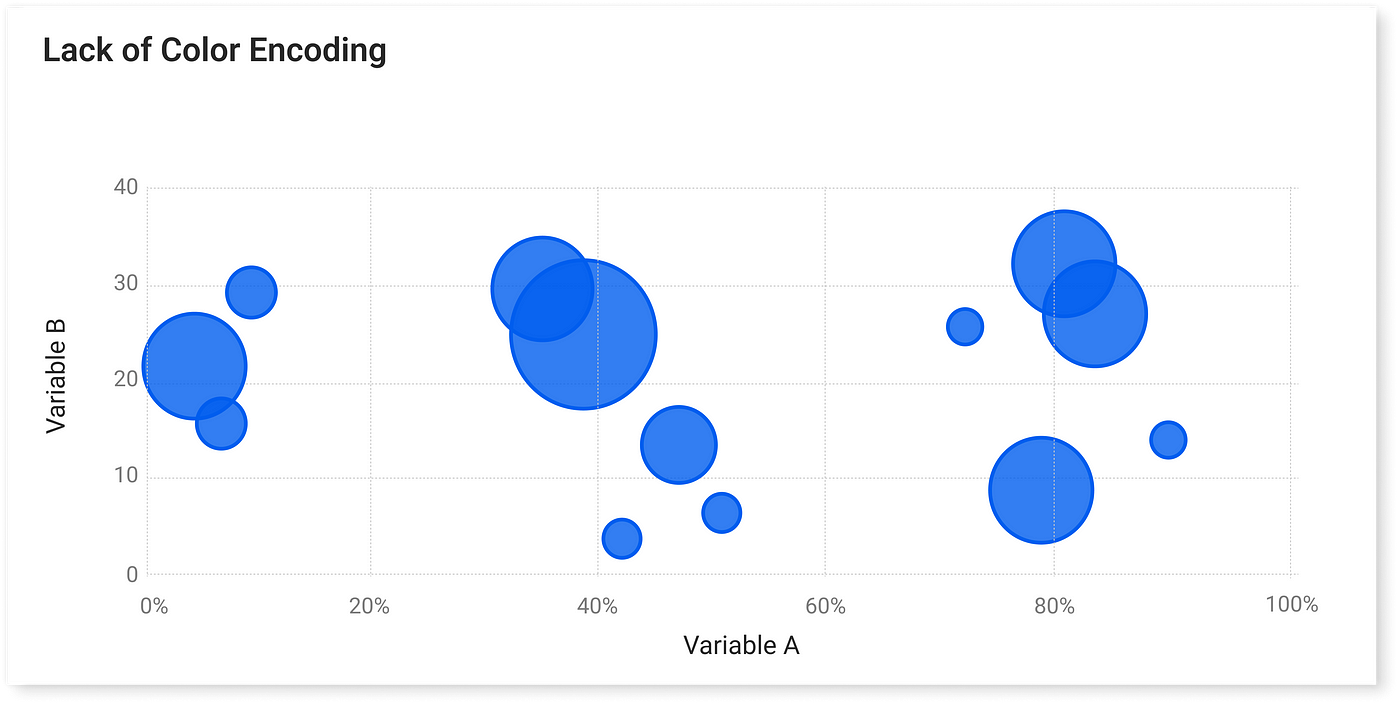
In the below example, color plays a purely decorative role and sets a mood rather than anything else. There is no additional value in coloring the data-ink*.
*Data-ink is a term created by Edward Tufte. It means ink devoted to the non-redundant display of data-information [3].

Using color to show relations
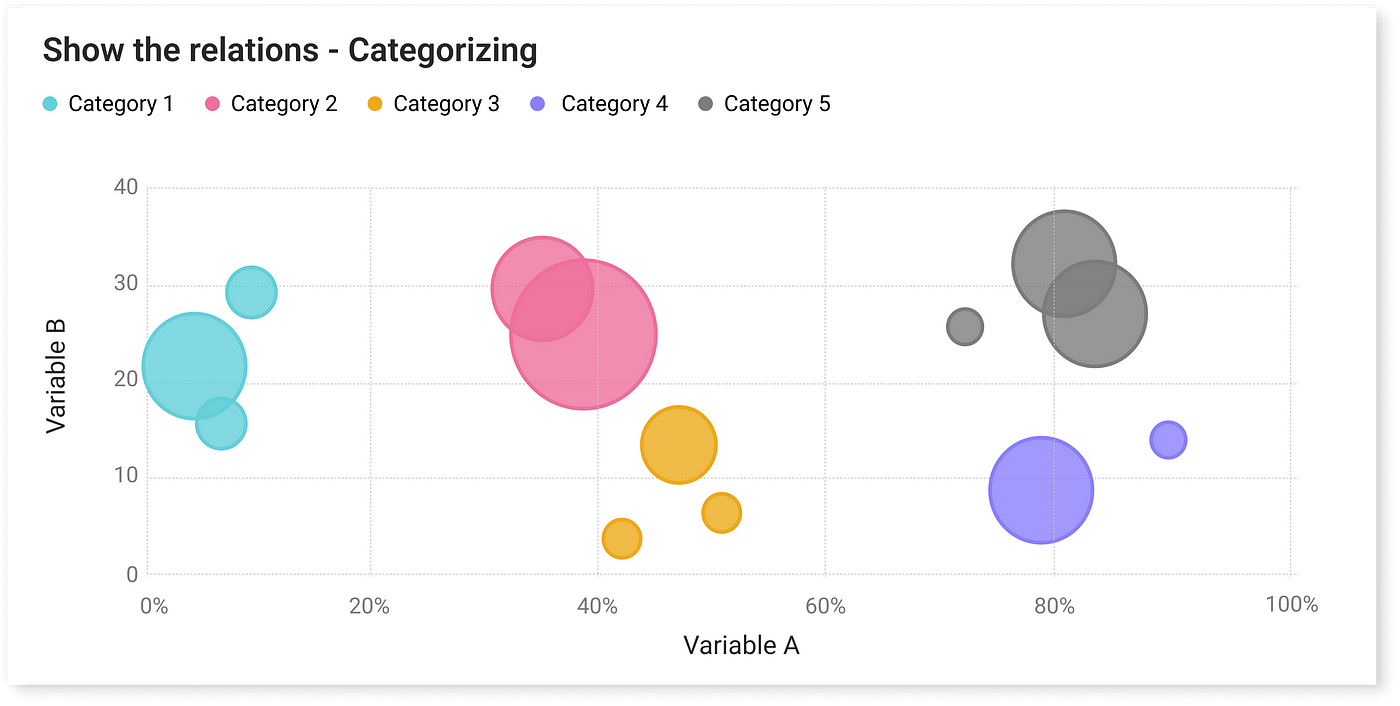
There are two ways of showing a relation: categorizing or grouping. In both cases, we want to distinguish members of one set from the others. And additionally, in the case of grouping, we want to show the sentiment. This requires using different approaches. For categorizing, we should use categorical color, while for grouping the diverging ones.

- Function: Categorizing
- Colors: Categorical*
- Purpose: Differentiate one category from the other
- Good practice: Keep colors easily distinguishable and with similar luminosity. You don’t have to be very strict with the latter as long as the one category isn’t more prominent than the rest, you are fine (see the example below).
*If you have categories following some natural order (e.g., age groups, income groups, education level), you can consider using a sequential palette or categorical with adjacent hues [4].


- Function: Grouping
- Colors: Diverging with or without the midpoint (grayish color)
- Purpose: Differentiate one category from the other and show the sentiment (that something is good/above or bad/below)
- Good practice: Use colors holding natural association, with similar luminosity (so one doesn’t outshine/drag more attention than the other), and are easily distinguishable by people with vision deficiency.
The most common color combination to show a good-bad relationship is green and red. But around 5% of the population makes those two colors hard to distinguish. It’s safer to use the red-blue combination instead or, if not possible, to add some blue tint to your green.
In the example below, you can see how people with different vision deficiencies perceive each color combination. The red-blue combination is easy to distinguish by everyone, whereas the regular red-green looks like one color for people with Deuteranopia.

Another aspect is connecting color with its meaning. There are some universal color associations, like cold is represented as blue, heat as red, earth as brown, and nature as green. I like the example of NASA Earth Observatory — when talking about the amount of rainfall deviation, it makes more sense to use the brown-blue combination, where brown means less rain/drought and blue means more rain. Suppose you can’t find any suitable combination. In that case, the safest choice is to select blue and red and use them as good-bad opposition (remember, blue, not green, due to the accessibility reasons mentioned above).

Using color to show different states
We can show different states by using color to highlight or to alert. Those two usages incorporate to the fullest the pre-attentive processing of the color. They help guide attention and emphasize vital data [5].

- Function: Highlight
- Colors: Binary Color Schemes with neutral and positive color
- Purpose: Show the importance of a particular point
- Good practice: Apply color only to the points you want to highlight and use gray for all others. You can use positive colors like blue, green, or brand colors. Another possibility is to differentiate the lightness and assign a darker shade to the data you want to highlight [5]. Ideally, you end up with a binary schema dividing the data into a highlighted part and the rest.

- Function: Alert
- Colors: Binary Color Schemes with neutral and alerting color
- Purpose: Drawing attention to something and sending the alert message
- Good practice: Pick the color that will draw attention quickly. Red is a good choice. The studies show that the emotional connotation of red switches between negative and positive. But what is important, in both emotional extremes red signals the presence of a significant stimulus and attracts attention [6]. Another good choice is pink or orange (the latter works well as the alerting color, or complementary color to the red showing lesser alert)
Using color to encode the value
The last function of the color is the encoding value. It can be used with a discrete or continuous scale. In both cases, we should use the colors that follow the order and pick either a sequential or diverging palette.


- Function: Encode value
- Colors: Sequential or diverging if there is a midpoint. Depending on the scale, use a discrete or continuous variant
- Purpose: Show the difference in value
- Good practice: The most important thing to remember when picking the sequential palette is a linear change in luminosity. Depending on the usage, you can pick the single-hue (perfect for a heat map) or multi-hue (goes well with a scatter plot). In my other article, you will find more tips on a sequential palette [7].
Color has many functions, but there are also some limitations. The most important among them are imprecise insights and being distracting when used excessively.
Color is not suitable for precise and accurate comparison
Even though color can be used to display values, it’s not good for precise and accurate comparison. As Cleveland and McGill’s study shows, there are ten elementary perceptual tasks that correlate with a method of representing data [8]. Based on the series of experiments, they ranked them according to the accuracy of the judgment. As shown on the graph below, shade and saturation are at the bottom of the ranking. This means they allow less accurate assessment; in other words, the user is more likely to make a mistake when assessing the value.

It doesn’t mean you should not use color to encode the data. But when the goal is to allow accurate comparison, a chart based on position (e.g., scatter plot, line chart) or length (bar chart, column chart, Gantt bar) beats other forms of representation.
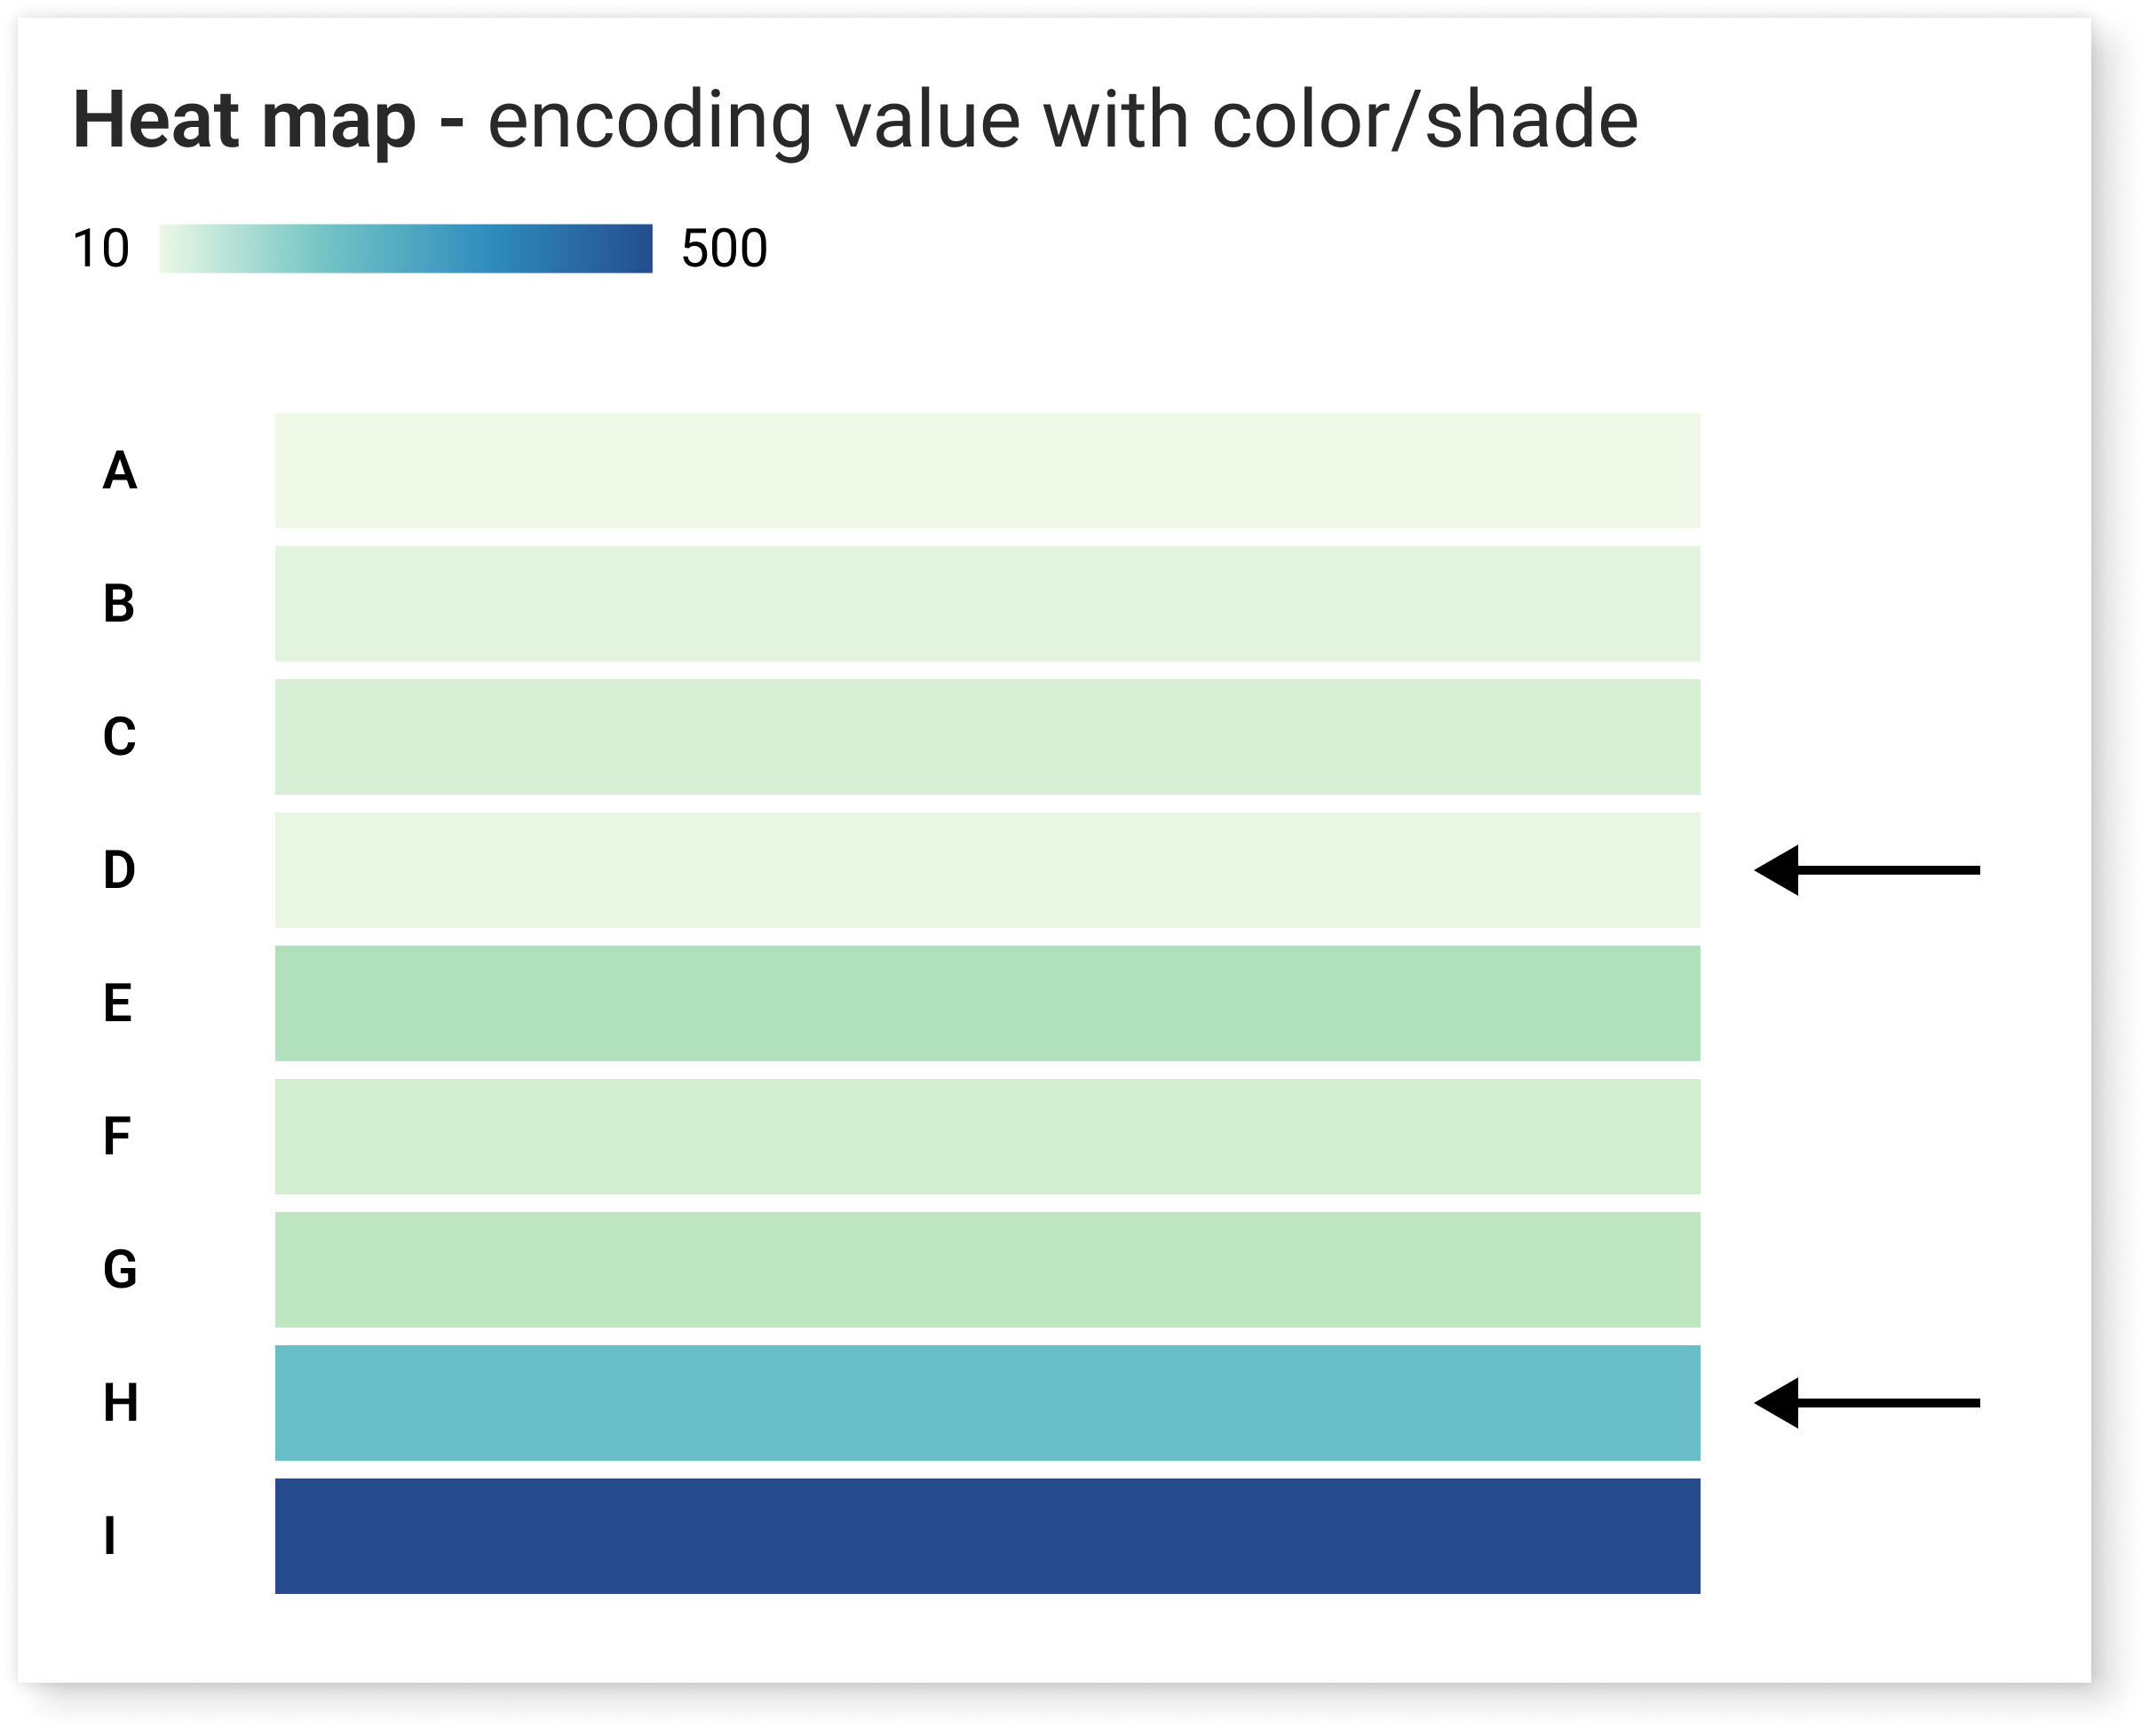
If you don’t believe it, let’s have a quick test. Using the charts below, try to tell what is the difference between D and H?**


Using too many colors
This is a wrong approach in general — there is a reason why most palettes for designers have a limited number of colors. There are many UI rules like 60–30–10 or having a max of 3 colors [10]. It’s no different when it comes to data visualization. The fewer colors, the better. Having too many categories will slow down information processing. Many resources say that the optimal number of colors is between 6 to 8. I personally like to keep it under 6, because each color you add to the legend increases the cognitive load of your audience.
Having a legend with ten colors on top of the chart means that the user has to either remember the association of ten different colors (imagine assigning them in a counterintuitive way) or jump back and forth between the chart and the legend. Both solutions engage the cognitive load, which is the most expensive one [11]. In the first solution, the user must remember the categories; in the second one, the already processed information.
Luckily there are some solutions to that. You can rethink the categories and limit the number of colors, change the chart type, or place the legend next to the data. Below is an example of how changing the legend placement and reducing the color usage lessen the cognitive load.


** The difference is the same for both charts. H is ten times bigger than D — H equals 200, whereas D equals 20.
Don’t wanna miss any of my posts? Get them directly to your inbox. Do that here!
And if you are not a part of Medium family yet, consider signing up for a membership. It only costs $5 per month, supporting thousands of writers. Sign up with my affiliate link, and apart from access to all published content, you will get my eternal gratitude.
[1] A. Cotgreave, Iraq’s Bloody Toll: control your message with title, colour and orientation (2014), GravyAnecdote
[2] W.Gawarska-Tywonek, Start with Choosing the Proper Palette (2022), Towards Data Science
[3] E. Tufte, The Visual Display of Quantitative Information (1983)
[4] A.Wilson, The Power of The Palette: Why Color is Key in Data Visualization and How to Use It (2017), Adobe Blog
[5] K. Nussbaumer Knaflic, Storytelling with Data: A Data Visualization Guide for Business Professionals (2015), Wiley
[6] M. Kuniecki, J. Pilarczyk, S.Wichary, The color red attracts attention in an emotional context. An ERP study (2015), Frontiers in Human Neuroscience
[7] W. Gawarska-Tywonek, 3 Tips to Master your Sequential Palette (2022), Towards Data Science
[8] W. Cleveland, R. McGill, Graphical Perception: Theory, Experimentation, and Application to the Development of Graphical Methods (1984), American Statistical Association
[9] A. Cairo, The Functional Art: an Introduction to Information Graphics and Visualization (2012), Addison Wesley
[10] N. Babich, 6 Simple Tips On Using Color In Your Design (2019), UX Planet
[11] S. Weinschenk, 100 Things Every Designer Needs to Know About People (2018)

USE COLOR MEANINGFULLY
Everything you need to know to create vivid charts
Color plays a significant role in any design, and data visualization is no different. On top of setting the tone, it often impacts our perception. Consider the following example. Without reading the title, what would you think if you saw the chart on the left (the red one)? And what would you think if you saw the chart on the right (the blue one)?

Both charts use the same data; in fact, they are mirror images. The first version is alerting — red bears a negative connotation, and it reminds us of the blood dripping from the wall. Looking at this version, you tend to focus on the extreme numbers. In comparison, the second version seems to deliver the opposite message. The blue color sets a more neutral, if not positive, tone, and you tend to focus on the recent decrease in numbers. In both cases, the message is strengthened by the suggestive title. But we get different insights and focus on various aspects because we perceive the color, even without seeing the title.
It happens because the color is one of the pre-attentive attributes, the visual features we detect instantly, without conscious processing. It affects our perception without us realizing it. The process is unconscious and driven by the culture and our previous experiences. Therefore it might vary among different people. Luckily, some guidelines help us use color carefully. I recommend checking the Color in Culture graph created by David McCandless.
As was already mentioned, you can use color to set the tone. Even though this function is important and worth mastering, I’d like to focus on three others that are sometimes overlooked: showing relations, showing different states, and displaying value.
All three start with recognizing the relationship between the data points and the color palette we should use. If you aren’t familiar with the color palettes and their usage, I recommend starting with my previous article dedicated to this topic [2]. If you know the difference between categorical, sequential, and diverging palettes, let’s analyze how we can incorporate them to show different functions of color using a standard bubble plot.
In the below example, color plays a purely decorative role and sets a mood rather than anything else. There is no additional value in coloring the data-ink*.
*Data-ink is a term created by Edward Tufte. It means ink devoted to the non-redundant display of data-information [3].

Using color to show relations
There are two ways of showing a relation: categorizing or grouping. In both cases, we want to distinguish members of one set from the others. And additionally, in the case of grouping, we want to show the sentiment. This requires using different approaches. For categorizing, we should use categorical color, while for grouping the diverging ones.

- Function: Categorizing
- Colors: Categorical*
- Purpose: Differentiate one category from the other
- Good practice: Keep colors easily distinguishable and with similar luminosity. You don’t have to be very strict with the latter as long as the one category isn’t more prominent than the rest, you are fine (see the example below).
*If you have categories following some natural order (e.g., age groups, income groups, education level), you can consider using a sequential palette or categorical with adjacent hues [4].


- Function: Grouping
- Colors: Diverging with or without the midpoint (grayish color)
- Purpose: Differentiate one category from the other and show the sentiment (that something is good/above or bad/below)
- Good practice: Use colors holding natural association, with similar luminosity (so one doesn’t outshine/drag more attention than the other), and are easily distinguishable by people with vision deficiency.
The most common color combination to show a good-bad relationship is green and red. But around 5% of the population makes those two colors hard to distinguish. It’s safer to use the red-blue combination instead or, if not possible, to add some blue tint to your green.
In the example below, you can see how people with different vision deficiencies perceive each color combination. The red-blue combination is easy to distinguish by everyone, whereas the regular red-green looks like one color for people with Deuteranopia.

Another aspect is connecting color with its meaning. There are some universal color associations, like cold is represented as blue, heat as red, earth as brown, and nature as green. I like the example of NASA Earth Observatory — when talking about the amount of rainfall deviation, it makes more sense to use the brown-blue combination, where brown means less rain/drought and blue means more rain. Suppose you can’t find any suitable combination. In that case, the safest choice is to select blue and red and use them as good-bad opposition (remember, blue, not green, due to the accessibility reasons mentioned above).

Using color to show different states
We can show different states by using color to highlight or to alert. Those two usages incorporate to the fullest the pre-attentive processing of the color. They help guide attention and emphasize vital data [5].

- Function: Highlight
- Colors: Binary Color Schemes with neutral and positive color
- Purpose: Show the importance of a particular point
- Good practice: Apply color only to the points you want to highlight and use gray for all others. You can use positive colors like blue, green, or brand colors. Another possibility is to differentiate the lightness and assign a darker shade to the data you want to highlight [5]. Ideally, you end up with a binary schema dividing the data into a highlighted part and the rest.

- Function: Alert
- Colors: Binary Color Schemes with neutral and alerting color
- Purpose: Drawing attention to something and sending the alert message
- Good practice: Pick the color that will draw attention quickly. Red is a good choice. The studies show that the emotional connotation of red switches between negative and positive. But what is important, in both emotional extremes red signals the presence of a significant stimulus and attracts attention [6]. Another good choice is pink or orange (the latter works well as the alerting color, or complementary color to the red showing lesser alert)
Using color to encode the value
The last function of the color is the encoding value. It can be used with a discrete or continuous scale. In both cases, we should use the colors that follow the order and pick either a sequential or diverging palette.


- Function: Encode value
- Colors: Sequential or diverging if there is a midpoint. Depending on the scale, use a discrete or continuous variant
- Purpose: Show the difference in value
- Good practice: The most important thing to remember when picking the sequential palette is a linear change in luminosity. Depending on the usage, you can pick the single-hue (perfect for a heat map) or multi-hue (goes well with a scatter plot). In my other article, you will find more tips on a sequential palette [7].
Color has many functions, but there are also some limitations. The most important among them are imprecise insights and being distracting when used excessively.
Color is not suitable for precise and accurate comparison
Even though color can be used to display values, it’s not good for precise and accurate comparison. As Cleveland and McGill’s study shows, there are ten elementary perceptual tasks that correlate with a method of representing data [8]. Based on the series of experiments, they ranked them according to the accuracy of the judgment. As shown on the graph below, shade and saturation are at the bottom of the ranking. This means they allow less accurate assessment; in other words, the user is more likely to make a mistake when assessing the value.

It doesn’t mean you should not use color to encode the data. But when the goal is to allow accurate comparison, a chart based on position (e.g., scatter plot, line chart) or length (bar chart, column chart, Gantt bar) beats other forms of representation.
If you don’t believe it, let’s have a quick test. Using the charts below, try to tell what is the difference between D and H?**


Using too many colors
This is a wrong approach in general — there is a reason why most palettes for designers have a limited number of colors. There are many UI rules like 60–30–10 or having a max of 3 colors [10]. It’s no different when it comes to data visualization. The fewer colors, the better. Having too many categories will slow down information processing. Many resources say that the optimal number of colors is between 6 to 8. I personally like to keep it under 6, because each color you add to the legend increases the cognitive load of your audience.
Having a legend with ten colors on top of the chart means that the user has to either remember the association of ten different colors (imagine assigning them in a counterintuitive way) or jump back and forth between the chart and the legend. Both solutions engage the cognitive load, which is the most expensive one [11]. In the first solution, the user must remember the categories; in the second one, the already processed information.
Luckily there are some solutions to that. You can rethink the categories and limit the number of colors, change the chart type, or place the legend next to the data. Below is an example of how changing the legend placement and reducing the color usage lessen the cognitive load.


** The difference is the same for both charts. H is ten times bigger than D — H equals 200, whereas D equals 20.
Don’t wanna miss any of my posts? Get them directly to your inbox. Do that here!
And if you are not a part of Medium family yet, consider signing up for a membership. It only costs $5 per month, supporting thousands of writers. Sign up with my affiliate link, and apart from access to all published content, you will get my eternal gratitude.
[1] A. Cotgreave, Iraq’s Bloody Toll: control your message with title, colour and orientation (2014), GravyAnecdote
[2] W.Gawarska-Tywonek, Start with Choosing the Proper Palette (2022), Towards Data Science
[3] E. Tufte, The Visual Display of Quantitative Information (1983)
[4] A.Wilson, The Power of The Palette: Why Color is Key in Data Visualization and How to Use It (2017), Adobe Blog
[5] K. Nussbaumer Knaflic, Storytelling with Data: A Data Visualization Guide for Business Professionals (2015), Wiley
[6] M. Kuniecki, J. Pilarczyk, S.Wichary, The color red attracts attention in an emotional context. An ERP study (2015), Frontiers in Human Neuroscience
[7] W. Gawarska-Tywonek, 3 Tips to Master your Sequential Palette (2022), Towards Data Science
[8] W. Cleveland, R. McGill, Graphical Perception: Theory, Experimentation, and Application to the Development of Graphical Methods (1984), American Statistical Association
[9] A. Cairo, The Functional Art: an Introduction to Information Graphics and Visualization (2012), Addison Wesley
[10] N. Babich, 6 Simple Tips On Using Color In Your Design (2019), UX Planet
[11] S. Weinschenk, 100 Things Every Designer Needs to Know About People (2018)
