
TiDE: the ‘embarrassingly’ simple MLP that beats Transformers
A deep exploration of TiDE, its implementation using Darts and a real life use case comparison with DeepAR (a Transformer architecture)
As industries continue to evolve, the importance of an accurate forecasting becomes a non-negotiable asset wether you work in e-commerce, healthcare, retail or even in agriculture. The importance of being able to foresee what comes next and plan accordingly to overcome future challenges is what can make you ahead of competition and thrive in an economy where margins are tight and the customers are more demanding than ever.
Transformer architectures have been the hot topic in AI for the past few years, specially due to their success in Natural Language Processing (NLP) being one of the most successful use cases the chatGPT that took the attention of everyone regardless if you were an AI enthusiastic or not. But NLP is not the only subject where Transformers have been shown to outperform the state-of-the-art solutions, in Computer Vision as well with Stable Diffusion and its variants.
But can Transformers outperform state-of-the-art models in time series? Although many efforts have been done to develop Transformers for time series forecasting, it seems that for long term horizons, simple linear models can outperform several Transformer based approaches.
In this article I explore TiDE, a simple deep learning model which is able to beat Transformer architectures in long term forecasting. I also provide a step-by-step implementation of TiDE to forecast weekly sales in a dataset from Walmart using Darts a forecasting library for Python. And finally, I compare the performance of TiDE and DeepAR in a real life use case from my company.
As always, the code is available on Github.
Time-series Dense Encoder Model (TiDE)
TiDE is a novel time-series encoder-decoder model that has shown to outperform state-of-the-art Transformer models in long-time horizon forecast [1]. It is a multivariate time-series model that is able to use static covariates (e.g. brand of a product) and dynamic covariates (e.g. price of a product) which can be known or unknown for the forecast horizon.
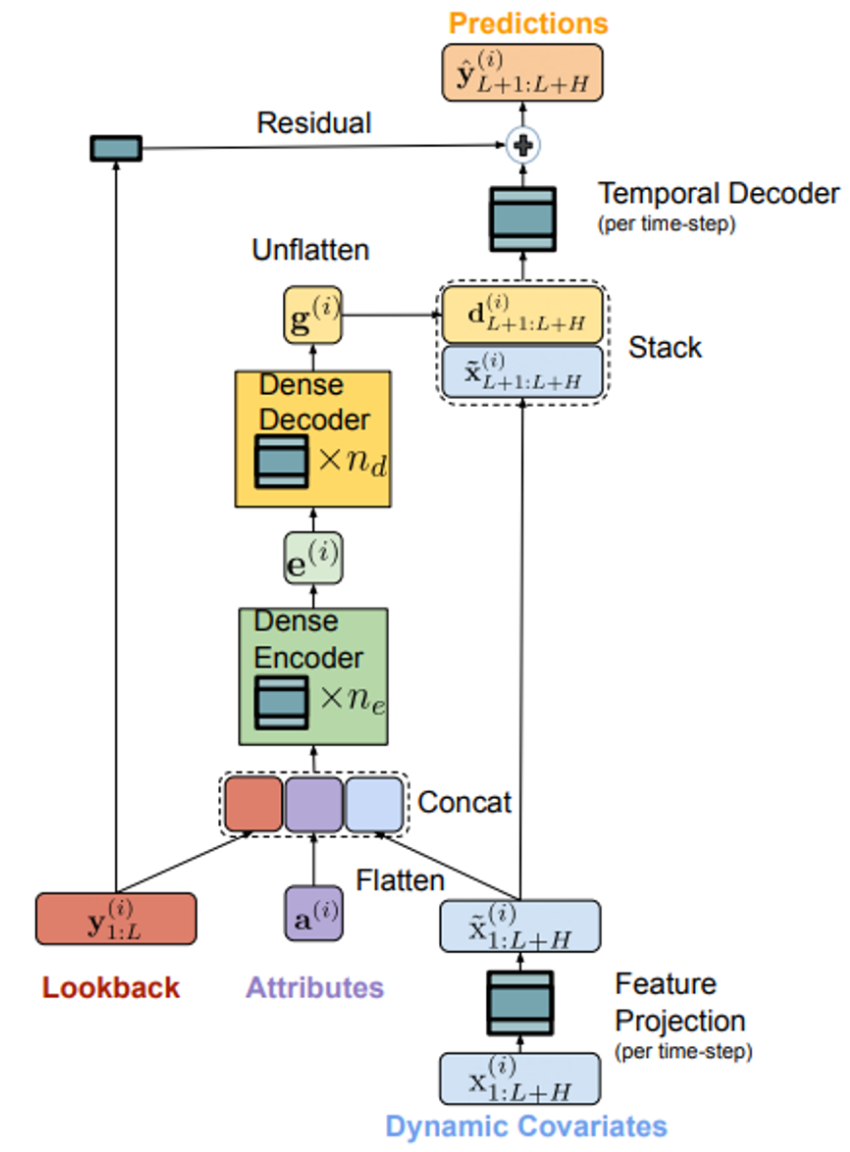
Unlike the complex architecture of Transformers, TiDE is based on a simple Encoder-Decoder architecture with only Multi-Layer Perceptron (MLP) and without any Attention layer.
The Encoder is responsible for mapping the past and the covariates of a time-series into a dense representation of features through two key steps:
- Feature Projection which reduces the dimensionality of the dynamic covariates for the whole look-back and the horizon. and;
- Dense Encoder which receives the output of the Feature Projection concatenated with static covariates and the past of the time-series and maps them into an embedding.
The Decoder receives the embedding from the encoder and converts it into future predictions through two operations:
- Dense Decoder which maps the embedding into a vector per time-step in the horizon; and
- Temporal Decoder which combines the output of the Dense Decoder with the projected features of that time-step to produce the predictions.
The Residual Connection linearly maps the look-back to a vector with the size of the horizon which is added to the output of the Temporal Decoder to produce the final predictions.
How to use TiDE in practice
This section covers a step by step implementation of TiDE using a weekly sales dataset from Walmart available on kaggle (License CC0: Public Domain) and resorting to a package called Darts.
Darts is a Python library for forecasting and anomaly detection [2] that contains several models such as naive models to serve as baseline, traditional models like ARIMA or Holt-Winters, deep learning models like TiDE or TFT or tree based models like LightGBM or Random Forest. It also supports both univariate and multivariate models and some of them offer probabilistic forecasting solutions.
The training dataset has 2 years and 8 months of weekly sales and 5 columns:
- Store — store number and one of the static covariates
- Dept — department number and the other static covariates
- Date — the temporal index of the time series which is weekly and it will be used to extract dynamic covariates like the week number and the month
- Weekly_Sales — the target variable
- IsHoliday — another dynamic covariate that identifies if there is a holiday in a certain week
The test dataset has the same columns except for the target (Weekly_Sales).
We start by importing the libraries we need and defining some global variables:
# Libraries
import pandas as pd
import numpy as np
from darts import TimeSeries
from darts.models import TiDEModel
from darts.dataprocessing.transformers import Scaler
from darts.utils.timeseries_generation import datetime_attribute_timeseries
from darts.utils.likelihood_models import QuantileRegression
from darts.dataprocessing.transformers import StaticCovariatesTransformer

# Global Variables
TIME_COL = "Date"
TARGET = "Weekly_Sales"
STATIC_COV = ["Store", "Dept"]
FREQ = "W-FRI"
SCALER = Scaler()
TRANSFORMER = StaticCovariatesTransformer()
The default scaler is MinMax Scaler, but we can use any we want from scikit-learn as long as it has fit(), transform() and inverse_transform() methods. The same happens for the transformer which by default is Label Encoder from scikit-learn.
After that, we load our training datasets and we convert the pandas data frames into TimeSeries which is the expected format from Darts.
I did not performed an EDA since my goal is just to show you how to implement it, but I noticed some negative values which might indicate returns. Nevertheless, I considered them as errors and I replaced them with 0.
I also used the argument fill_missing_dates to add missing weeks and I filled those dates also with 0.
# read train and test datasets and transform train dataset
train = pd.read_csv('data/train.csv')
train["Date"] = pd.to_datetime(train["Date"])
train[TARGET] = np.where(train[TARGET] < 0, 0, train[TARGET])
train_darts = TimeSeries.from_group_dataframe(
 df=train,
 group_cols=STATIC_COV,
 time_col=TIME_COL,
 value_cols=TARGET,
 static_cols=STATIC_COV,
 freq=FREQ,
 fill_missing_dates=True,
 fillna_value=0)
We also load our test dataset so that we define what is our forecast horizon and what are the holidays in the forecast horizon.
# read test dataset and determine Forecast Horizon
test = pd.read_csv('data/test.csv')
test["Date"] = pd.to_datetime(test["Date"])
FORECAST_HORIZON = len(test['Date'].unique())
After that, for each serie in the training set we create dynamic covariates:
# we get the holiday data that we have in both train and test dataset
holidays_df = pd.concat([train[["Date", "IsHoliday"]], test[["Date", "IsHoliday"]]]).drop_duplicates()
# convert bool to numeric
holidays_df["IsHoliday"] = holidays_df["IsHoliday"]*1
# create dynamic covariates for each serie in the training darts
dynamic_covariates = []
for serie in train_darts:
    # add the month and week as a covariate
    covariate = datetime_attribute_timeseries(
        serie,
        attribute="month",
        one_hot=True,
        cyclic=False,
        add_length=FORECAST_HORIZON,
    )
    covariate = covariate.stack(
        datetime_attribute_timeseries(
            serie,
            attribute="week",
            one_hot=True,
            cyclic=False,
            add_length=FORECAST_HORIZON,
        )
    )

  # create holidays with dates for training and test
    holidays_serie = pd.merge(pd.DataFrame(covariate.time_index).rename(columns={'time':'Date'}), holidays_df, on='Date', how='left')
    covariate = covariate.stack(
                TimeSeries.from_dataframe(holidays_serie, time_col="Date", value_cols="IsHoliday", freq=FREQ)
            )
    dynamic_covariates.append(covariate)
Now, that we have all the data ready we just need to scale our data:
# scale covariates
dynamic_covariates_transformed = SCALER.fit_transform(dynamic_covariates)
# scale data
data_transformed = SCALER.fit_transform(train_darts)
# transform static covariates
data_transformed = TRANSFORMER.fit_transform(data_transformed)
Finally, we are ready to make predictions!
In our case, we will predict for the next 38 weeks the weekly sales for the same series that we trained with, however you can also forecast for time series that are not part of your training set as long as they have the same static covariates. For that, you have to repeat the same process of data preparation.
TiDE_params = {
    "input_chunk_length": 4, # number of weeks to lookback
    "output_chunk_length": FORECAST_HORIZON,
    "num_encoder_layers": 1,
    "num_decoder_layers": 1,
    "decoder_output_dim": 1,
    "hidden_size": 15,
    "temporal_width_past": 4,
    "temporal_width_future": 4,
    "temporal_decoder_hidden": 26,
    "dropout": 0.1,
    "batch_size": 16,
    "n_epochs": 5,
    "likelihood": QuantileRegression(quantiles=[0.25, 0.5, 0.75]),
    "random_state": 42,
    "use_static_covariates": True,
    "optimizer_kwargs": {"lr": 1e-3},
    "use_reversible_instance_norm": False,
}

model = TiDEModel(**TiDE_params)
model.fit(data_transformed, future_covariates=dynamic_covariates_transformed, verbose=False)
pred = SCALER.inverse_transform(model.predict(n=FORECAST_HORIZON, series=data_transformed, future_covariates=dynamic_covariates_transformed, num_samples=50))
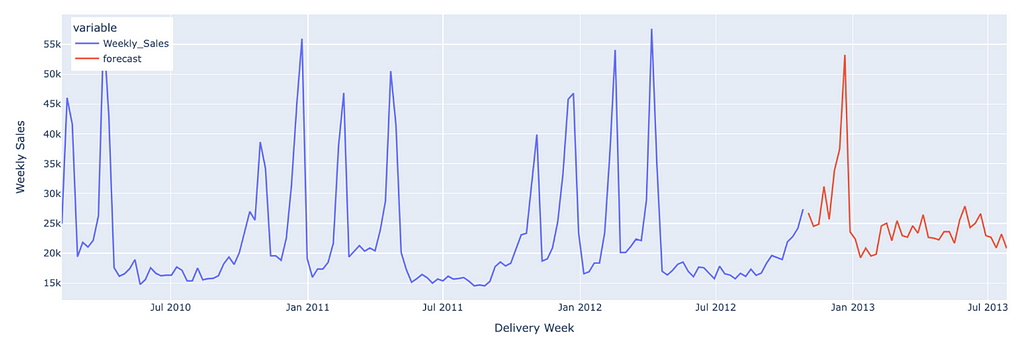
Here we have an example of the forecast for Store 1 and Dept 1, where we can see that the model was able to forecast a spike in the week of Black Friday and Thanksgiving of 2012 due to the three dynamic covariates that we had (week, month and the binary column which identifies a holiday in a certain week). However, we can also see that there are several spikes across the year that comes probably from discounts or marketing campaigns that can be handled by dynamic covariates to improve our forecast and that data is also available on kaggle.
TiDE vs DeepAR in a real life use case
In my company, we deployed, in the end of 2022, a new forecasting model which aimed to predict the volume of orders of 264 time series for the next 16 weeks.
The model that beat the one in production at that time was DeepAR, a Transformer architecture available in the Python library GluonTS [3]. Like TiDE, DeepAR allows the use of static and dynamic covariates.
Although DeepAR was providing us good results, it suffered from a problem on longer horizons (+8 weeks) that we called ‘Exploding Predictions’. From one week to the other, with just one more week of data, the model would make a total different forecast from the previous week with volumes higher than normal.
Nevertheless, we came up with mechanisms to control this and change one particular hyper parameter (context length, that DeepAR is really sensitive to) to avoid this kind of situations, but lately it has been shown to not be enough and we had to closely monitor every week the results and change other hyper parameters to come up with a reasonable forecast.
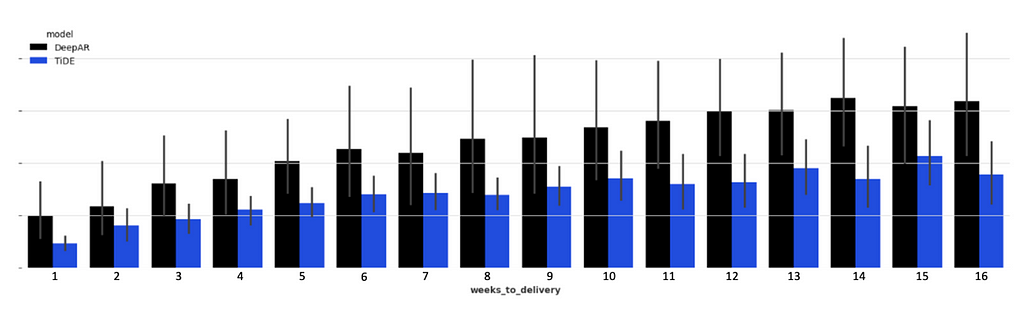
So we decided to start a new round of research to find a model that is more stable and reliable and it was when we found TiDE. We optimised TiDE in terms of hyper parameters, which dynamic and static covariates to use, which series would go to training and which would not, etc. And we compared both optimised models, DeepAR and TiDE, in 26 different cut off dates for a entire year of data from July 2022 to July 2023.
The results showed that TiDE was not just better than DeepAR in the short and long term (as you can see in Figure 4) but it did not suffer from the initial problem we wanted to solve of ‘Exploding Predictions’.
Conclusion
Transformer architectures will be the foundation for the next big revolution in the history of humanity. Like we saw with industrial revolution, I believe that AI revolution will have a similar impact if not bigger.
Although Transformers are amazing for NLP and Computer Vision, they cannot outperform simpler models on long term forecasting as stated by the authors in [1] and as we have seen in the use case from my company, where DeepAR performs worse than TiDE.
It is fair to say that there are other Transformer architectures that can be better than DeepAR like TFT [5] and I did not show a comparison between TFT and TiDE, but I did compare them while assessing a new model for my company, and it did not beat TiDE.
Nevertheless, if Transformer architectures were robust enough for long term forecasting, why would Google develop a new non Transformer time series model? TSMixer [5] is the latest model developed by Google for time series that beats transformers (including DeepAR and TFT) in M5 competition.
For now, simpler models seem to be better for forecasting but let’s see what the future holds in this subject and if Transformers can be improved to provide better results on the long term!
Keep in touch: LinkedIn, Medium
References
[1] Abhimanyu Das, Weihao Kong, Andrew Leach, Shaan Mathur, Rajat Sen, Rose Yu. Long-term Forecasting with TiDE: Time-series Dense Encoder. arXiv:2304.08424, 2023
[2] Julien Herzen, Francesco Lässig, Samuele Giuliano Piazzetta, Thomas Neuer, Léo Tafti, Guillaume Raille, Tomas Van Pottelbergh, Marek Pasieka, Andrzej Skrodzki, Nicolas Huguenin, Maxime Dumonal, Jan Kościsz, Dennis Bader, Frédérick Gusset, Mounir Benheddi, Camila Williamson, Michal Kosinski, Matej Petrik, Gaël Grosch. Darts: User-Friendly Modern Machine Learning for Time Series, 2022
[3] Alexander Alexandrov, Konstantinos Benidis, Michael Bohlke-Schneider, Valentin Flunkert, Jan Gasthaus, Tim Januschowski, Danielle C. Maddix, Syama Rangapuram, David Salinas, Jasper Schulz, Lorenzo Stella, Ali Caner Türkmen, Yuyang Wang. GluonTS: Probabilistic Time Series Models in Python. arXiv:1906.05264, 2019
[4] Bryan Lim, Sercan O. Arik, Nicolas Loeff, Tomas Pfister. Temporal Fusion Transformers for Interpretable Multi-horizon Time Series Forecasting. arXiv:1912.09363, 2019
[5] Si-An Chen, Chun-Liang Li, Nate Yoder, Sercan O. Arik, Tomas Pfister. TSMixer: An All-MLP Architecture for Time Series Forecasting. arXiv:2303.06053, 2023
TiDE: the ‘embarrassingly’ simple MLP that beats Transformers was originally published in Towards Data Science on Medium, where people are continuing the conversation by highlighting and responding to this story.
A deep exploration of TiDE, its implementation using Darts and a real life use case comparison with DeepAR (a Transformer architecture)
As industries continue to evolve, the importance of an accurate forecasting becomes a non-negotiable asset wether you work in e-commerce, healthcare, retail or even in agriculture. The importance of being able to foresee what comes next and plan accordingly to overcome future challenges is what can make you ahead of competition and thrive in an economy where margins are tight and the customers are more demanding than ever.
Transformer architectures have been the hot topic in AI for the past few years, specially due to their success in Natural Language Processing (NLP) being one of the most successful use cases the chatGPT that took the attention of everyone regardless if you were an AI enthusiastic or not. But NLP is not the only subject where Transformers have been shown to outperform the state-of-the-art solutions, in Computer Vision as well with Stable Diffusion and its variants.
But can Transformers outperform state-of-the-art models in time series? Although many efforts have been done to develop Transformers for time series forecasting, it seems that for long term horizons, simple linear models can outperform several Transformer based approaches.
In this article I explore TiDE, a simple deep learning model which is able to beat Transformer architectures in long term forecasting. I also provide a step-by-step implementation of TiDE to forecast weekly sales in a dataset from Walmart using Darts a forecasting library for Python. And finally, I compare the performance of TiDE and DeepAR in a real life use case from my company.

As always, the code is available on Github.
Time-series Dense Encoder Model (TiDE)
TiDE is a novel time-series encoder-decoder model that has shown to outperform state-of-the-art Transformer models in long-time horizon forecast [1]. It is a multivariate time-series model that is able to use static covariates (e.g. brand of a product) and dynamic covariates (e.g. price of a product) which can be known or unknown for the forecast horizon.
Unlike the complex architecture of Transformers, TiDE is based on a simple Encoder-Decoder architecture with only Multi-Layer Perceptron (MLP) and without any Attention layer.
The Encoder is responsible for mapping the past and the covariates of a time-series into a dense representation of features through two key steps:
- Feature Projection which reduces the dimensionality of the dynamic covariates for the whole look-back and the horizon. and;
- Dense Encoder which receives the output of the Feature Projection concatenated with static covariates and the past of the time-series and maps them into an embedding.
The Decoder receives the embedding from the encoder and converts it into future predictions through two operations:
- Dense Decoder which maps the embedding into a vector per time-step in the horizon; and
- Temporal Decoder which combines the output of the Dense Decoder with the projected features of that time-step to produce the predictions.
The Residual Connection linearly maps the look-back to a vector with the size of the horizon which is added to the output of the Temporal Decoder to produce the final predictions.
How to use TiDE in practice
This section covers a step by step implementation of TiDE using a weekly sales dataset from Walmart available on kaggle (License CC0: Public Domain) and resorting to a package called Darts.
Darts is a Python library for forecasting and anomaly detection [2] that contains several models such as naive models to serve as baseline, traditional models like ARIMA or Holt-Winters, deep learning models like TiDE or TFT or tree based models like LightGBM or Random Forest. It also supports both univariate and multivariate models and some of them offer probabilistic forecasting solutions.
The training dataset has 2 years and 8 months of weekly sales and 5 columns:
- Store — store number and one of the static covariates
- Dept — department number and the other static covariates
- Date — the temporal index of the time series which is weekly and it will be used to extract dynamic covariates like the week number and the month
- Weekly_Sales — the target variable
- IsHoliday — another dynamic covariate that identifies if there is a holiday in a certain week
The test dataset has the same columns except for the target (Weekly_Sales).
We start by importing the libraries we need and defining some global variables:
# Libraries
import pandas as pd
import numpy as np
from darts import TimeSeries
from darts.models import TiDEModel
from darts.dataprocessing.transformers import Scaler
from darts.utils.timeseries_generation import datetime_attribute_timeseries
from darts.utils.likelihood_models import QuantileRegression
from darts.dataprocessing.transformers import StaticCovariatesTransformer

# Global Variables
TIME_COL = "Date"
TARGET = "Weekly_Sales"
STATIC_COV = ["Store", "Dept"]
FREQ = "W-FRI"
SCALER = Scaler()
TRANSFORMER = StaticCovariatesTransformer()
The default scaler is MinMax Scaler, but we can use any we want from scikit-learn as long as it has fit(), transform() and inverse_transform() methods. The same happens for the transformer which by default is Label Encoder from scikit-learn.
After that, we load our training datasets and we convert the pandas data frames into TimeSeries which is the expected format from Darts.
I did not performed an EDA since my goal is just to show you how to implement it, but I noticed some negative values which might indicate returns. Nevertheless, I considered them as errors and I replaced them with 0.
I also used the argument fill_missing_dates to add missing weeks and I filled those dates also with 0.
# read train and test datasets and transform train dataset
train = pd.read_csv('data/train.csv')
train["Date"] = pd.to_datetime(train["Date"])
train[TARGET] = np.where(train[TARGET] < 0, 0, train[TARGET])
train_darts = TimeSeries.from_group_dataframe(
 df=train,
 group_cols=STATIC_COV,
 time_col=TIME_COL,
 value_cols=TARGET,
 static_cols=STATIC_COV,
 freq=FREQ,
 fill_missing_dates=True,
 fillna_value=0)
We also load our test dataset so that we define what is our forecast horizon and what are the holidays in the forecast horizon.
# read test dataset and determine Forecast Horizon
test = pd.read_csv('data/test.csv')
test["Date"] = pd.to_datetime(test["Date"])
FORECAST_HORIZON = len(test['Date'].unique())
After that, for each serie in the training set we create dynamic covariates:
# we get the holiday data that we have in both train and test dataset
holidays_df = pd.concat([train[["Date", "IsHoliday"]], test[["Date", "IsHoliday"]]]).drop_duplicates()
# convert bool to numeric
holidays_df["IsHoliday"] = holidays_df["IsHoliday"]*1
# create dynamic covariates for each serie in the training darts
dynamic_covariates = []
for serie in train_darts:
    # add the month and week as a covariate
    covariate = datetime_attribute_timeseries(
        serie,
        attribute="month",
        one_hot=True,
        cyclic=False,
        add_length=FORECAST_HORIZON,
    )
    covariate = covariate.stack(
        datetime_attribute_timeseries(
            serie,
            attribute="week",
            one_hot=True,
            cyclic=False,
            add_length=FORECAST_HORIZON,
        )
    )

  # create holidays with dates for training and test
    holidays_serie = pd.merge(pd.DataFrame(covariate.time_index).rename(columns={'time':'Date'}), holidays_df, on='Date', how='left')
    covariate = covariate.stack(
                TimeSeries.from_dataframe(holidays_serie, time_col="Date", value_cols="IsHoliday", freq=FREQ)
            )
    dynamic_covariates.append(covariate)
Now, that we have all the data ready we just need to scale our data:
# scale covariates
dynamic_covariates_transformed = SCALER.fit_transform(dynamic_covariates)
# scale data
data_transformed = SCALER.fit_transform(train_darts)
# transform static covariates
data_transformed = TRANSFORMER.fit_transform(data_transformed)
Finally, we are ready to make predictions!
In our case, we will predict for the next 38 weeks the weekly sales for the same series that we trained with, however you can also forecast for time series that are not part of your training set as long as they have the same static covariates. For that, you have to repeat the same process of data preparation.
TiDE_params = {
    "input_chunk_length": 4, # number of weeks to lookback
    "output_chunk_length": FORECAST_HORIZON,
    "num_encoder_layers": 1,
    "num_decoder_layers": 1,
    "decoder_output_dim": 1,
    "hidden_size": 15,
    "temporal_width_past": 4,
    "temporal_width_future": 4,
    "temporal_decoder_hidden": 26,
    "dropout": 0.1,
    "batch_size": 16,
    "n_epochs": 5,
    "likelihood": QuantileRegression(quantiles=[0.25, 0.5, 0.75]),
    "random_state": 42,
    "use_static_covariates": True,
    "optimizer_kwargs": {"lr": 1e-3},
    "use_reversible_instance_norm": False,
}

model = TiDEModel(**TiDE_params)
model.fit(data_transformed, future_covariates=dynamic_covariates_transformed, verbose=False)
pred = SCALER.inverse_transform(model.predict(n=FORECAST_HORIZON, series=data_transformed, future_covariates=dynamic_covariates_transformed, num_samples=50))
Here we have an example of the forecast for Store 1 and Dept 1, where we can see that the model was able to forecast a spike in the week of Black Friday and Thanksgiving of 2012 due to the three dynamic covariates that we had (week, month and the binary column which identifies a holiday in a certain week). However, we can also see that there are several spikes across the year that comes probably from discounts or marketing campaigns that can be handled by dynamic covariates to improve our forecast and that data is also available on kaggle.
TiDE vs DeepAR in a real life use case
In my company, we deployed, in the end of 2022, a new forecasting model which aimed to predict the volume of orders of 264 time series for the next 16 weeks.
The model that beat the one in production at that time was DeepAR, a Transformer architecture available in the Python library GluonTS [3]. Like TiDE, DeepAR allows the use of static and dynamic covariates.
Although DeepAR was providing us good results, it suffered from a problem on longer horizons (+8 weeks) that we called ‘Exploding Predictions’. From one week to the other, with just one more week of data, the model would make a total different forecast from the previous week with volumes higher than normal.
Nevertheless, we came up with mechanisms to control this and change one particular hyper parameter (context length, that DeepAR is really sensitive to) to avoid this kind of situations, but lately it has been shown to not be enough and we had to closely monitor every week the results and change other hyper parameters to come up with a reasonable forecast.
So we decided to start a new round of research to find a model that is more stable and reliable and it was when we found TiDE. We optimised TiDE in terms of hyper parameters, which dynamic and static covariates to use, which series would go to training and which would not, etc. And we compared both optimised models, DeepAR and TiDE, in 26 different cut off dates for a entire year of data from July 2022 to July 2023.
The results showed that TiDE was not just better than DeepAR in the short and long term (as you can see in Figure 4) but it did not suffer from the initial problem we wanted to solve of ‘Exploding Predictions’.
Conclusion
Transformer architectures will be the foundation for the next big revolution in the history of humanity. Like we saw with industrial revolution, I believe that AI revolution will have a similar impact if not bigger.
Although Transformers are amazing for NLP and Computer Vision, they cannot outperform simpler models on long term forecasting as stated by the authors in [1] and as we have seen in the use case from my company, where DeepAR performs worse than TiDE.
It is fair to say that there are other Transformer architectures that can be better than DeepAR like TFT [5] and I did not show a comparison between TFT and TiDE, but I did compare them while assessing a new model for my company, and it did not beat TiDE.
Nevertheless, if Transformer architectures were robust enough for long term forecasting, why would Google develop a new non Transformer time series model? TSMixer [5] is the latest model developed by Google for time series that beats transformers (including DeepAR and TFT) in M5 competition.
For now, simpler models seem to be better for forecasting but let’s see what the future holds in this subject and if Transformers can be improved to provide better results on the long term!
Keep in touch: LinkedIn, Medium
References
[1] Abhimanyu Das, Weihao Kong, Andrew Leach, Shaan Mathur, Rajat Sen, Rose Yu. Long-term Forecasting with TiDE: Time-series Dense Encoder. arXiv:2304.08424, 2023
[2] Julien Herzen, Francesco Lässig, Samuele Giuliano Piazzetta, Thomas Neuer, Léo Tafti, Guillaume Raille, Tomas Van Pottelbergh, Marek Pasieka, Andrzej Skrodzki, Nicolas Huguenin, Maxime Dumonal, Jan Kościsz, Dennis Bader, Frédérick Gusset, Mounir Benheddi, Camila Williamson, Michal Kosinski, Matej Petrik, Gaël Grosch. Darts: User-Friendly Modern Machine Learning for Time Series, 2022
[3] Alexander Alexandrov, Konstantinos Benidis, Michael Bohlke-Schneider, Valentin Flunkert, Jan Gasthaus, Tim Januschowski, Danielle C. Maddix, Syama Rangapuram, David Salinas, Jasper Schulz, Lorenzo Stella, Ali Caner Türkmen, Yuyang Wang. GluonTS: Probabilistic Time Series Models in Python. arXiv:1906.05264, 2019
[4] Bryan Lim, Sercan O. Arik, Nicolas Loeff, Tomas Pfister. Temporal Fusion Transformers for Interpretable Multi-horizon Time Series Forecasting. arXiv:1912.09363, 2019
[5] Si-An Chen, Chun-Liang Li, Nate Yoder, Sercan O. Arik, Tomas Pfister. TSMixer: An All-MLP Architecture for Time Series Forecasting. arXiv:2303.06053, 2023
TiDE: the ‘embarrassingly’ simple MLP that beats Transformers was originally published in Towards Data Science on Medium, where people are continuing the conversation by highlighting and responding to this story.
Denial of responsibility! Techno Blender is an automatic aggregator of the all world’s media. In each content, the hyperlink to the primary source is specified. All trademarks belong to their rightful owners, all materials to their authors. If you are the owner of the content and do not want us to publish your materials, please contact us by email – [email protected]. The content will be deleted within 24 hours.