
Time Series Forecasting: Beyond the Basics
Tips and tricks to unlock the true potential of time series forecasting in the real-world
The ability to predict the future is a superpower!
Fortunately, Time Series Forecasting exists and is accessible to anyone and everyone! This superpower can enable anyone to make proactive decisions and improve their planning for the future. The applications of time series forecasting are endless; think about being able to predict the demand for a product in your business, make more informed financial decisions on your investments or simply being able to forecast the weather.
While the internet overflows with resources covering the core principles of forecasting, the real-world complexities often go beyond textbook lessons. This guide delves into the unspoken secrets I’ve discovered through my years of applying this powerful tool in business settings. We will explore various strategies that go beyond the typical focus on feature engineering and model selection to help you truly unlock the potential of Time Series Forecasting.
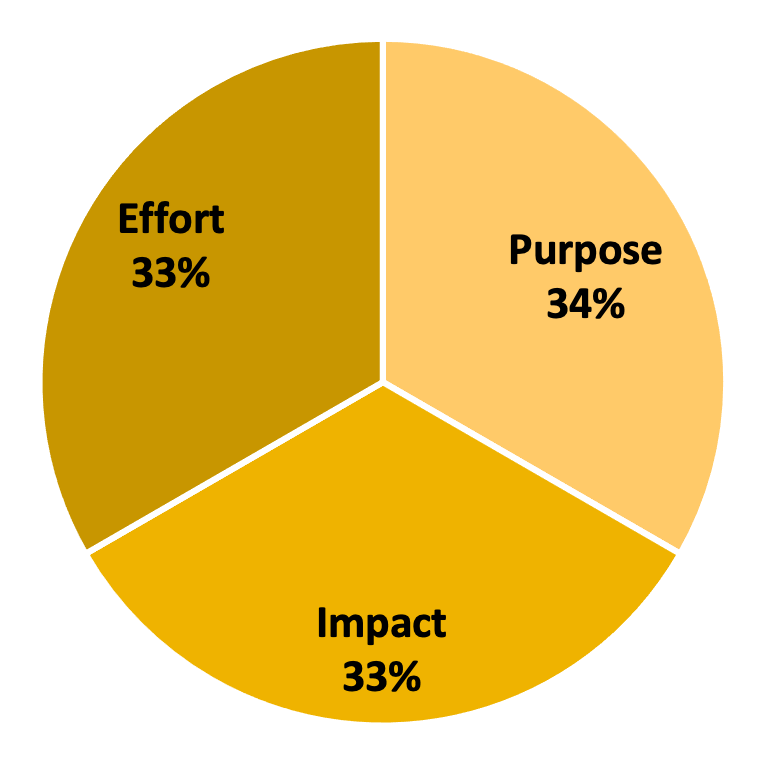
1. Purpose, Impact, Effort (PIE) framework
2. Domain Knowledge
3. Non-Stationarity and Sudden Shifts
4. Stakeholder Management

1. Purpose, Impact, Effort (PIE) framework
The first key step in any Data Science project is to always to look at the Purpose, Impact, and Effort associated with their work. Before heading into the complex world of data analysis and modelling, it’s important to pause and evaluate the fundamental questions: What is the purpose of this endeavour? What impact will it ultimately have? And is it worth the effort?
Data science projects often require alot of time and resources. Therefore, the crucial question you must continuously ask yourself is “How much additional value does the organization gain by utilising data science?”
Surprisingly, the answer to this question is not always straightforward. Sometimes, choosing a ‘quick and dirty’ solution — in line with the Pareto Principle, where 20% of the effort yields 80% of the results — solves most everyday problems, so why spend the extra time and effort if a simpler solution can suffice?
This is where the PIE framework comes into play. Beyond the incredibly exciting data science techniques lies an important decision: Is the marginal benefit of using more advanced techniques really worth the additional cost and effort? In most cases, the answer is a resounding “no.”
As exciting as it may seem, it’s important to think critically about any data science project before jumping straight in. By following the PIE framework, you can confidently decide on the right projects to undertake ensuring that your efforts are both meaningful and impactful.
2. Domain Knowledge
Many courses and textbooks usually focus on teaching various time series forecasting techniques, often presenting them as the key ingredient for success. However, as experience has taught me in the real world, the real “secret weapon” is not in the model itself, but deeply understanding the data you’re working with. There is no one-size-fits-all forecasting model.
For example, imagine trying to build your dream house on a foundation of loose sand. You can approach the best architects and builders, and create the most intricate blueprint, but ultimately the house is destined for disaster. Similarly, building a robust forecasting model with irrelevant data or riddled with errors and inconsistencies is like building on unstable ground. The model’s outputs will be unreliable and prone to collapse.

Domain knowledge, in the context of time series forecasting, is more than just knowing what the data represents. It’s about digging in deeply and understanding the underlying relationships, mechanisms, and nuances specific to the problem you’re analysing. Each dataset is unique and your investigation into understanding the data will vary with every project.
While this step can seem quite boring, it can make or break the entire project. From informing feature engineering decisions to guiding model selection, domain knowledge plays a very important role in shaping the project. If you’re able to find and utilise the best data to feed into the model, your output would be considerably more useful.
3. Non-Stationarity and Sudden Shifts
When you first learn about Time Series forecasting, you’ll often encounter the core assumption of “Stationarity” in lots of forecasting models. However, in the real world, Time series data rarely conforms to this assumption. Instead, you’ll find that the data and interactions change over time. This is usually characterized by fluctuations, trends, and seasonality. When building a reliable forecasting model, it is important to identify and accommodate these dynamic patterns to accurately capture and predict the underlying trends and behaviour.
Another common problem is when sudden shifts or discontinuities occur in the data. Traditional forecasting methods don’t handle these sorts of shifts very well, but it is important to take these into consideration. These breaks can be a result of external factors ranging from changes in market conditions, shifts in consumer behaviour, or the introduction of new regulations or technologies. They may not always be directly measurable or available, but this is where your expertise would come into play here in finding the best way to account for these nuances.
For example, imagine you’re trying to predict the number of viewers of the English Premier League football. Apart from the obvious on/off-season, there are a few other quirks that happen, such as a high seasonal effect towards the end of the season where the stakes are higher, and viewers become more interested. Now imagine Messi moves to the Premier League or Sky Sports increase their monthly subscription fee — these sudden shifts are sometimes unpredictable but impacts the actual viewership quite significantly.
There’s no easy way to handle these shifts, but there are techniques that can help. Here are a few approaches that I typically use to address these nuances, but the application of them is highly dependent on the nature of the data;
1. Time series decomposition — This involves separating the data into its core components — such as trend, seasonality, and noise. This step should typically be done as part of the pre-analysis to better understand the data and model each component’s behaviour individually.
2. Exogenous features — These are the external variables that you think affect the short-term volatility or the long-term trends of the data. This can be manual flags or the other important features to use as regressors. Domain Knowledge is crucial here. For each sudden shift, there is usually an explanation. It’s not always possible to incorporate each explanation as a feature, so it’s important to filter through the most useful, reliable, and predictable ones to avoid overfitting.
3. Adaptive Modelling — This involves selecting the most appropriate model that can detect and adapt to shifts in the underlying patterns. This step is one of my favourites as it involves research in finding or creating the best model for the data. However, it’s easier said than done. There may be times where this may involve some manual work, such as hyperparameter tuning or utilising a specific model that considers certain nuances of the data. Keep in mind that this may also increase the risk of overfitting.
While these techniques can’t perfectly predict every unprecedented effect, they do prepare us more for them and build more robust forecasting models.
4. Stakeholder Management
Successful implementation of a model goes far beyond the technical intricacies of model selection and data analysis — it encompasses effective stakeholder management. Think of ‘Stakeholder Management’ as tailoring the process to the people involved. The goal is to ensure that your model is doing what it needs to do, and you continue to bring value. How you tailor the process and output depends on the needs of the stakeholders, whether this is executives, managers or consumers. It’s all about delivering actionable insights that enable them to make informed decisions.
As a data scientist, your worth is often determined by how well you translate your technical insights into real-world decision-making. This is both a blessing and a curse to most of us — soft skills are notoriously undervalued in technical fields, but acts as the bridge between our mind-crunching work and the value than can be derived from it. While technical skills are important for the foundation for our work, your ability to communicate effectively, empathize with stakeholders, and drive action is what truly elevates our impact. Communication is the single most important skill as a data scientist, yet it is stereotypically also the most difficult to acquire.
Below are some actionable tips that can help in effective communication:
1. Tailoring model selection
Choosing the right model goes far beyond identifying the most accurate algorithm.
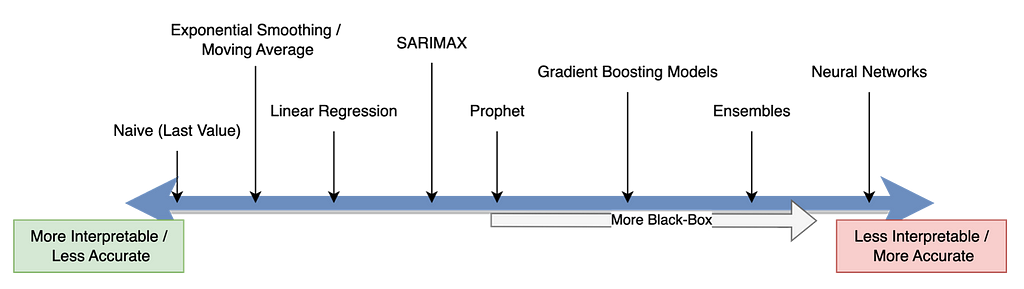
It’s true that black-box models can be the most accurate and engaging for us Data Scientists, but they’re often not transparent or easily interpretable, making it hard for stakeholders to trust the results. This is where it may be better to opt for simpler models like ARIMA or Exponential Smoothing where you may decrease accuracy but increase interpretability. It is always best to do research on the various models that exist.
Here’s an example of some of the most common forecasting models and their interpretability;
2. Clear Visualisations
Present your results in a way that resonates with your audience.
Think about well-designed charts, graphs, and dashboards. This involves clarity, simplicity, and relevance to the audience. How can you help stakeholders grasp key insights quickly and make informed decisions?
There are numerous articles and courses online that help in data visualisation!
Executives might favour high-level dashboards, while managers might require detailed reports with error metrics. Consumers typically benefit from clear and actionable visualizations that translate forecasts into practical applications.
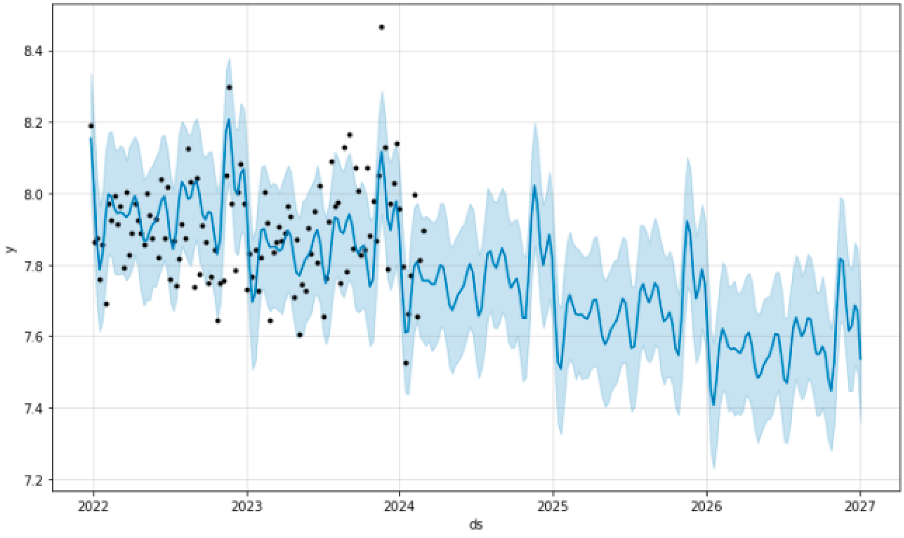
Personally, I take a lot of inspiration from Prophet’s base visualisations as it clearly depicts the actual values vs the model predictions. I usually add annotations or highlight certain points (both future and past) for significant moments.
3. Storytelling
Don’t just present data; tell a story. Highlight the context, key findings, and potential implications of your forecasts. Understand your audience and frame the narrative in a way that is relevant to the specific goals and challenges.
Focus on the “Why” before the “How”
- What is the overall objective you’re trying to achieve with the forecast
- How will the forecasts be used to inform decision-making?
- What are the potential consequences of inaccurate forecasts?
- Acknowledge the limitations and uncertainties in the model’s predictions
Highlight the Journey, not just the Destination
- Always tie in the journey to the main task at hand.
- Share key challenges you encountered during data pre-processing or model selection and how you overcame them.
- Highlight any unexpected insights you discovered along the way.
Make it Relatable and Actionable
- Speak the language of your audience.
- Quantify the potential impact of your forecasts on metrics like revenue, cost savings, or resource allocation.
- Offer clear recommendations and actionable steps stakeholders can take based on your insights.
Remember, the key to successful forecasting goes far beyond the accuracy of the model, to its ability to empower stakeholders to make informed decisions. Time-series forecasting is a powerful tool, so use it wisely and carefully!
Unless otherwise noted, all images are by the author.
Time Series Forecasting: Beyond the Basics was originally published in Towards Data Science on Medium, where people are continuing the conversation by highlighting and responding to this story.
Tips and tricks to unlock the true potential of time series forecasting in the real-world

The ability to predict the future is a superpower!
Fortunately, Time Series Forecasting exists and is accessible to anyone and everyone! This superpower can enable anyone to make proactive decisions and improve their planning for the future. The applications of time series forecasting are endless; think about being able to predict the demand for a product in your business, make more informed financial decisions on your investments or simply being able to forecast the weather.
While the internet overflows with resources covering the core principles of forecasting, the real-world complexities often go beyond textbook lessons. This guide delves into the unspoken secrets I’ve discovered through my years of applying this powerful tool in business settings. We will explore various strategies that go beyond the typical focus on feature engineering and model selection to help you truly unlock the potential of Time Series Forecasting.
1. Purpose, Impact, Effort (PIE) framework
2. Domain Knowledge
3. Non-Stationarity and Sudden Shifts
4. Stakeholder Management
1. Purpose, Impact, Effort (PIE) framework
The first key step in any Data Science project is to always to look at the Purpose, Impact, and Effort associated with their work. Before heading into the complex world of data analysis and modelling, it’s important to pause and evaluate the fundamental questions: What is the purpose of this endeavour? What impact will it ultimately have? And is it worth the effort?
Data science projects often require alot of time and resources. Therefore, the crucial question you must continuously ask yourself is “How much additional value does the organization gain by utilising data science?”
Surprisingly, the answer to this question is not always straightforward. Sometimes, choosing a ‘quick and dirty’ solution — in line with the Pareto Principle, where 20% of the effort yields 80% of the results — solves most everyday problems, so why spend the extra time and effort if a simpler solution can suffice?
This is where the PIE framework comes into play. Beyond the incredibly exciting data science techniques lies an important decision: Is the marginal benefit of using more advanced techniques really worth the additional cost and effort? In most cases, the answer is a resounding “no.”
As exciting as it may seem, it’s important to think critically about any data science project before jumping straight in. By following the PIE framework, you can confidently decide on the right projects to undertake ensuring that your efforts are both meaningful and impactful.
2. Domain Knowledge
Many courses and textbooks usually focus on teaching various time series forecasting techniques, often presenting them as the key ingredient for success. However, as experience has taught me in the real world, the real “secret weapon” is not in the model itself, but deeply understanding the data you’re working with. There is no one-size-fits-all forecasting model.
For example, imagine trying to build your dream house on a foundation of loose sand. You can approach the best architects and builders, and create the most intricate blueprint, but ultimately the house is destined for disaster. Similarly, building a robust forecasting model with irrelevant data or riddled with errors and inconsistencies is like building on unstable ground. The model’s outputs will be unreliable and prone to collapse.
Domain knowledge, in the context of time series forecasting, is more than just knowing what the data represents. It’s about digging in deeply and understanding the underlying relationships, mechanisms, and nuances specific to the problem you’re analysing. Each dataset is unique and your investigation into understanding the data will vary with every project.
While this step can seem quite boring, it can make or break the entire project. From informing feature engineering decisions to guiding model selection, domain knowledge plays a very important role in shaping the project. If you’re able to find and utilise the best data to feed into the model, your output would be considerably more useful.
3. Non-Stationarity and Sudden Shifts
When you first learn about Time Series forecasting, you’ll often encounter the core assumption of “Stationarity” in lots of forecasting models. However, in the real world, Time series data rarely conforms to this assumption. Instead, you’ll find that the data and interactions change over time. This is usually characterized by fluctuations, trends, and seasonality. When building a reliable forecasting model, it is important to identify and accommodate these dynamic patterns to accurately capture and predict the underlying trends and behaviour.
Another common problem is when sudden shifts or discontinuities occur in the data. Traditional forecasting methods don’t handle these sorts of shifts very well, but it is important to take these into consideration. These breaks can be a result of external factors ranging from changes in market conditions, shifts in consumer behaviour, or the introduction of new regulations or technologies. They may not always be directly measurable or available, but this is where your expertise would come into play here in finding the best way to account for these nuances.
For example, imagine you’re trying to predict the number of viewers of the English Premier League football. Apart from the obvious on/off-season, there are a few other quirks that happen, such as a high seasonal effect towards the end of the season where the stakes are higher, and viewers become more interested. Now imagine Messi moves to the Premier League or Sky Sports increase their monthly subscription fee — these sudden shifts are sometimes unpredictable but impacts the actual viewership quite significantly.
There’s no easy way to handle these shifts, but there are techniques that can help. Here are a few approaches that I typically use to address these nuances, but the application of them is highly dependent on the nature of the data;
1. Time series decomposition — This involves separating the data into its core components — such as trend, seasonality, and noise. This step should typically be done as part of the pre-analysis to better understand the data and model each component’s behaviour individually.
2. Exogenous features — These are the external variables that you think affect the short-term volatility or the long-term trends of the data. This can be manual flags or the other important features to use as regressors. Domain Knowledge is crucial here. For each sudden shift, there is usually an explanation. It’s not always possible to incorporate each explanation as a feature, so it’s important to filter through the most useful, reliable, and predictable ones to avoid overfitting.
3. Adaptive Modelling — This involves selecting the most appropriate model that can detect and adapt to shifts in the underlying patterns. This step is one of my favourites as it involves research in finding or creating the best model for the data. However, it’s easier said than done. There may be times where this may involve some manual work, such as hyperparameter tuning or utilising a specific model that considers certain nuances of the data. Keep in mind that this may also increase the risk of overfitting.
While these techniques can’t perfectly predict every unprecedented effect, they do prepare us more for them and build more robust forecasting models.
4. Stakeholder Management
Successful implementation of a model goes far beyond the technical intricacies of model selection and data analysis — it encompasses effective stakeholder management. Think of ‘Stakeholder Management’ as tailoring the process to the people involved. The goal is to ensure that your model is doing what it needs to do, and you continue to bring value. How you tailor the process and output depends on the needs of the stakeholders, whether this is executives, managers or consumers. It’s all about delivering actionable insights that enable them to make informed decisions.
As a data scientist, your worth is often determined by how well you translate your technical insights into real-world decision-making. This is both a blessing and a curse to most of us — soft skills are notoriously undervalued in technical fields, but acts as the bridge between our mind-crunching work and the value than can be derived from it. While technical skills are important for the foundation for our work, your ability to communicate effectively, empathize with stakeholders, and drive action is what truly elevates our impact. Communication is the single most important skill as a data scientist, yet it is stereotypically also the most difficult to acquire.
Below are some actionable tips that can help in effective communication:
1. Tailoring model selection
Choosing the right model goes far beyond identifying the most accurate algorithm.
It’s true that black-box models can be the most accurate and engaging for us Data Scientists, but they’re often not transparent or easily interpretable, making it hard for stakeholders to trust the results. This is where it may be better to opt for simpler models like ARIMA or Exponential Smoothing where you may decrease accuracy but increase interpretability. It is always best to do research on the various models that exist.
Here’s an example of some of the most common forecasting models and their interpretability;
2. Clear Visualisations
Present your results in a way that resonates with your audience.
Think about well-designed charts, graphs, and dashboards. This involves clarity, simplicity, and relevance to the audience. How can you help stakeholders grasp key insights quickly and make informed decisions?
There are numerous articles and courses online that help in data visualisation!
Executives might favour high-level dashboards, while managers might require detailed reports with error metrics. Consumers typically benefit from clear and actionable visualizations that translate forecasts into practical applications.
Personally, I take a lot of inspiration from Prophet’s base visualisations as it clearly depicts the actual values vs the model predictions. I usually add annotations or highlight certain points (both future and past) for significant moments.
3. Storytelling
Don’t just present data; tell a story. Highlight the context, key findings, and potential implications of your forecasts. Understand your audience and frame the narrative in a way that is relevant to the specific goals and challenges.
Focus on the “Why” before the “How”
- What is the overall objective you’re trying to achieve with the forecast
- How will the forecasts be used to inform decision-making?
- What are the potential consequences of inaccurate forecasts?
- Acknowledge the limitations and uncertainties in the model’s predictions
Highlight the Journey, not just the Destination
- Always tie in the journey to the main task at hand.
- Share key challenges you encountered during data pre-processing or model selection and how you overcame them.
- Highlight any unexpected insights you discovered along the way.
Make it Relatable and Actionable
- Speak the language of your audience.
- Quantify the potential impact of your forecasts on metrics like revenue, cost savings, or resource allocation.
- Offer clear recommendations and actionable steps stakeholders can take based on your insights.
Remember, the key to successful forecasting goes far beyond the accuracy of the model, to its ability to empower stakeholders to make informed decisions. Time-series forecasting is a powerful tool, so use it wisely and carefully!
Unless otherwise noted, all images are by the author.
Time Series Forecasting: Beyond the Basics was originally published in Towards Data Science on Medium, where people are continuing the conversation by highlighting and responding to this story.
Denial of responsibility! Techno Blender is an automatic aggregator of the all world’s media. In each content, the hyperlink to the primary source is specified. All trademarks belong to their rightful owners, all materials to their authors. If you are the owner of the content and do not want us to publish your materials, please contact us by email – [email protected]. The content will be deleted within 24 hours.