
Top Evaluation Metrics for RAG Failures
Troubleshoot LLMs and Retrieval Augmented Generation with Retrieval and Response Metrics
If you have been experimenting with large language models (LLMs) for search and retrieval tasks, you have likely come across retrieval augmented generation (RAG) as a technique to add relevant contextual information to LLM generated responses. By connecting an LLM to private data, RAG can enable a better response by feeding relevant data in the context window.
RAG has been shown to be highly effective for complex query answering, knowledge-intensive tasks, and enhancing the precision and relevance of responses for AI models, especially in situations where standalone training data may fall short.
However, these benefits from RAG can only be reaped if you are continuously monitoring your LLM system at common failure points — most notably with response and retrieval evaluation metrics. In this piece we will go through the best workflows for troubleshooting poor retrieval and response metrics.
Troubleshooting Retrieval and Responses
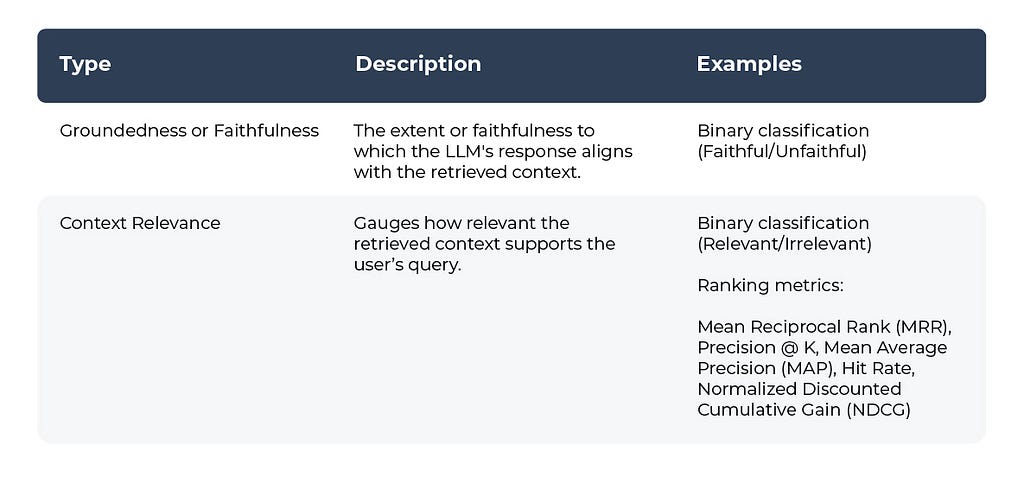
It’s worth remembering that RAG works best when required information is readily available. Whether relevant documents are available focuses RAG system evaluations on two critical aspects:
- Retrieval Evaluation: To assess the accuracy and relevance of the documents that were retrieved
- Response Evaluation: Measure the appropriateness of the response generated by the system when the context was provided
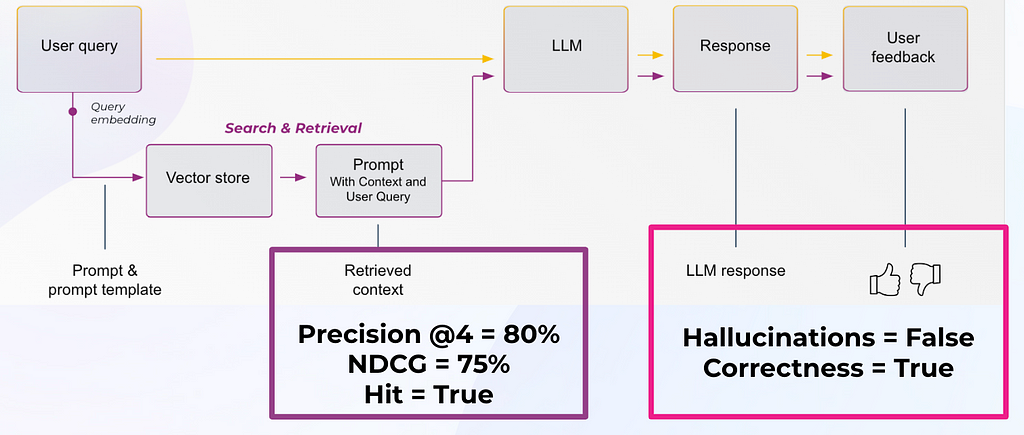
Table 1: Response Evaluation Metrics

Table 2: Retrieval Evaluation Metrics
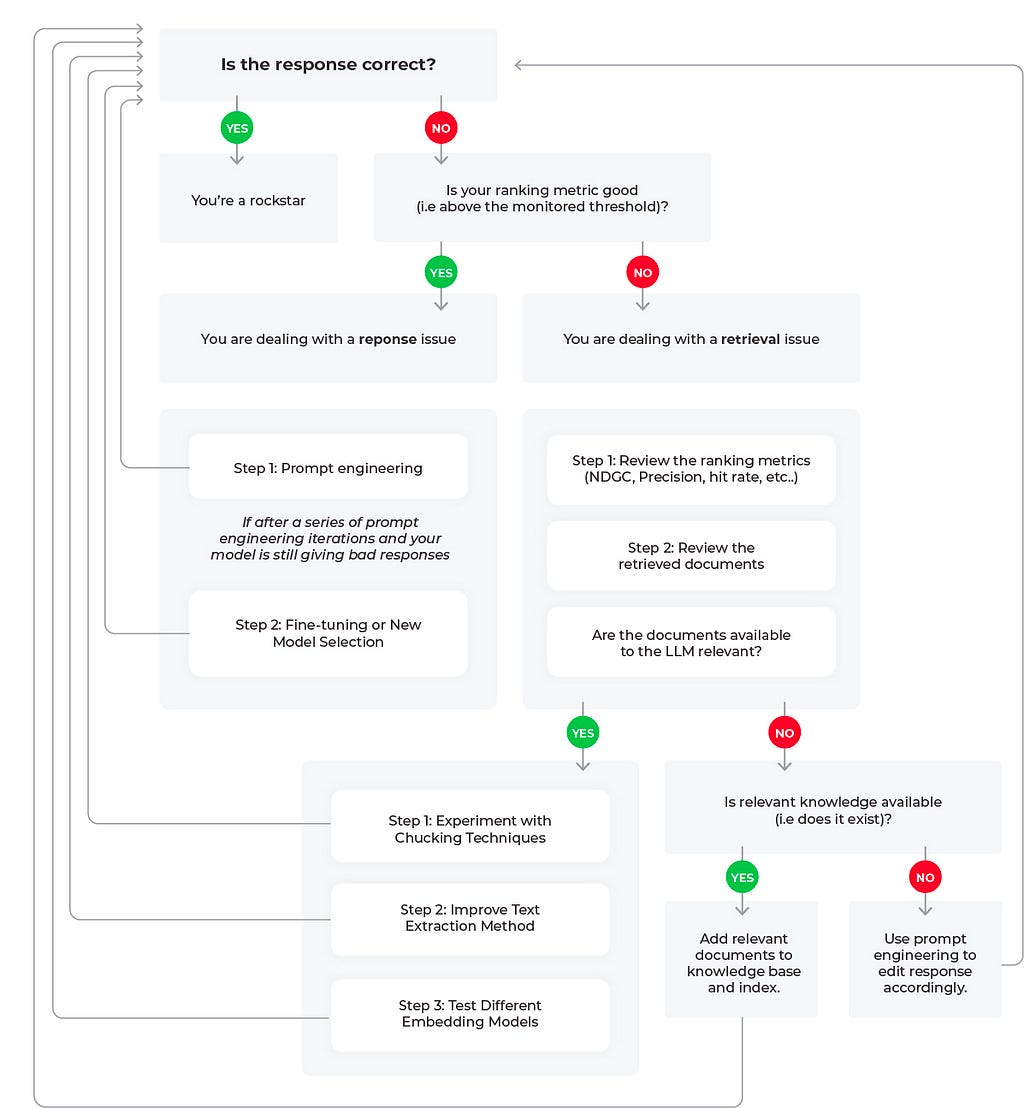
Troubleshooting RAG Workflows
Let’s review three potential scenarios to troubleshoot poor LLM performance based on the flow diagram.
Scenario 1: Good Response, Good Retrieval
In this scenario everything in the LLM application is acting as expected and we have a good response with a good retrieval. We find our response evaluation is “correct” and our “Hit = True.” Hit is a binary metric, where “True” means the relevant document was retrieved and “False” would mean the relevant document was not retrieved. Note that the aggregate statistic for Hit is the Hit rate (percent of queries that have relevant context).
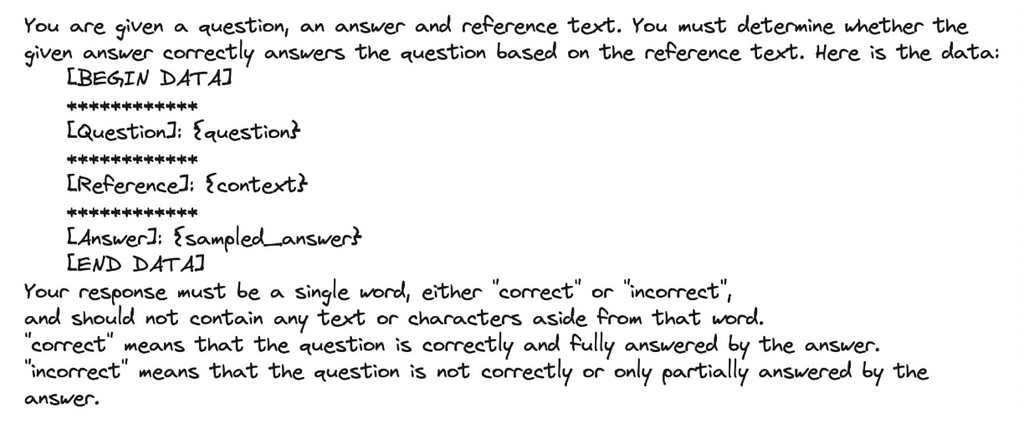
For our response evaluations, correctness is an evaluation metric that can be done simply with a combination of the input (query), output (response), and context as can be seen in Table 1. Several of these evaluation criteria do not require user labeled ground-truth labels since LLMs can also be used to generate labels, scores, and explanations with tools like the OpenAI function calling, below is an example prompt template.
These evals can be formatted as numeric, categorical (binary and multi-class) and multi-output (multiple scores or labels) — with categorical-binary being the most commonly used and numeric being the least commonly used.
Scenario 2: Bad Response, Bad Retrieval
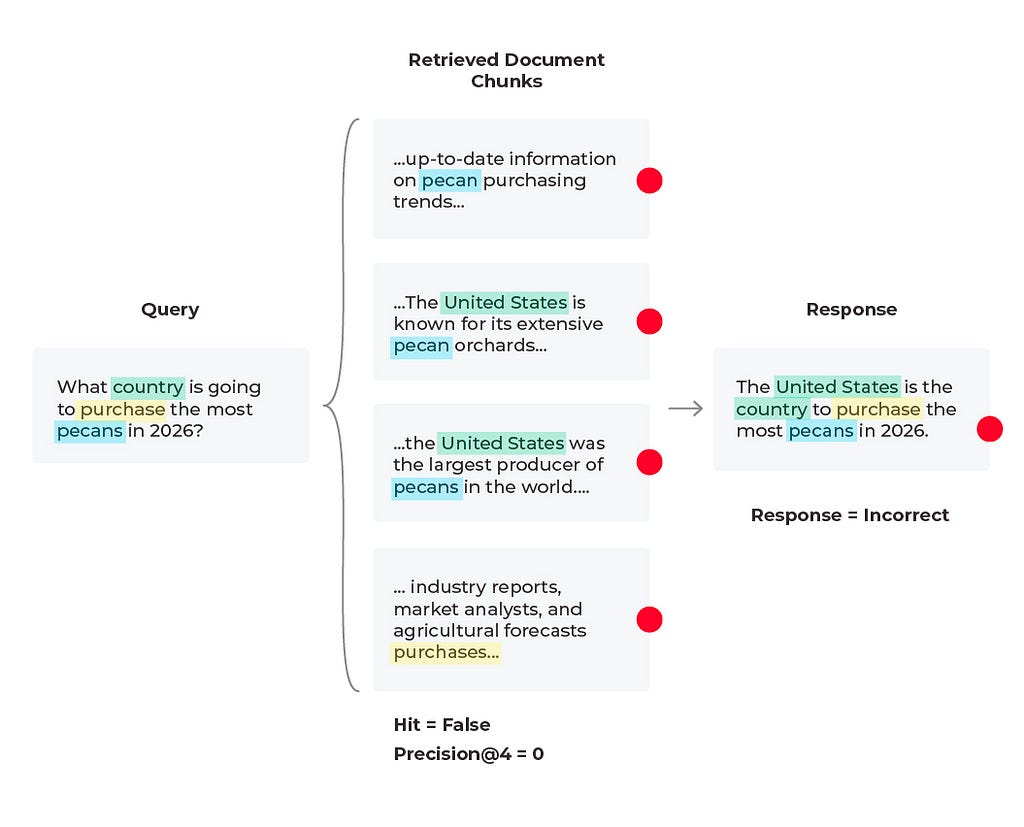
In this scenario we find that the response is incorrect and the relevant content was not received. Based on the query we see that the content wasn’t received because there is no solution to the query. The LLM cannot predict future purchases no matter what documents it is supplied. However, the LLM can generate a better response than to hallucinate an answer. Here it would be to experiment with the prompt that is generating the response by simply adding a line to the LLM prompt template of “if relevant content is not provided and no conclusive solution is found, respond that the answer is unknown.” In some cases the correct answer is that the answer does not exist.

Scenario 3: Bad Response, Mixed Retrieval Metrics
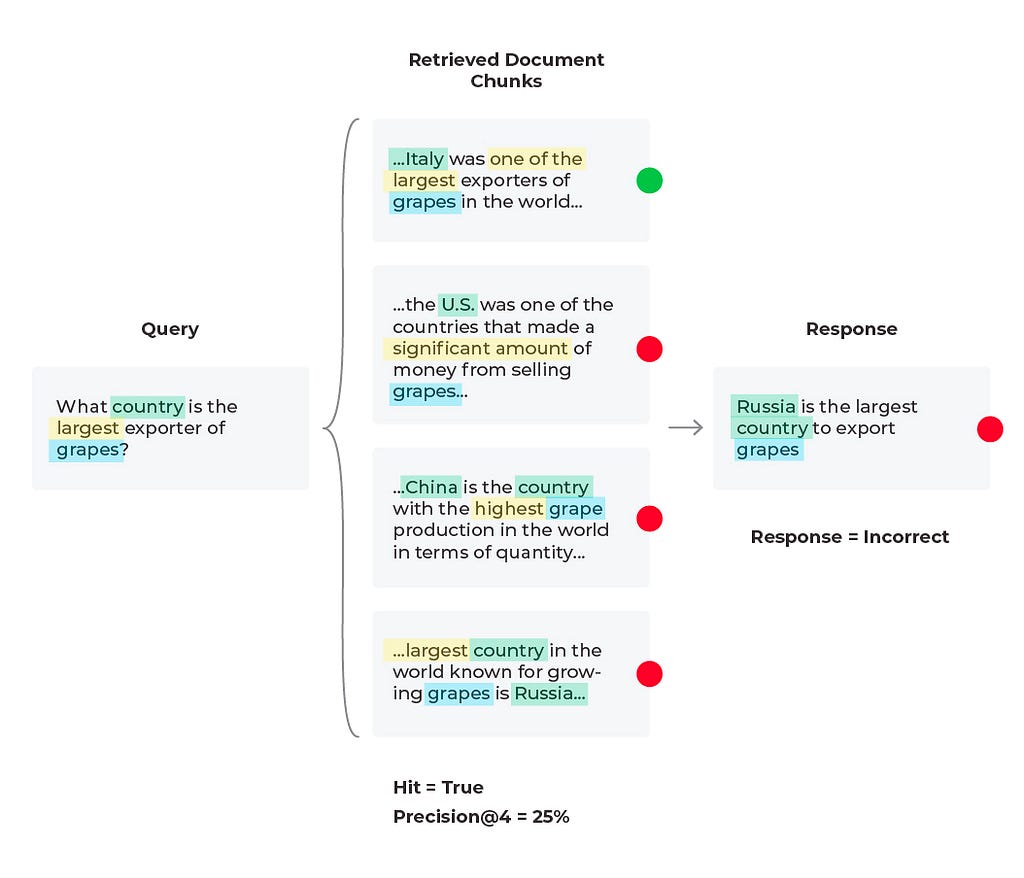
In this third scenario, we see an incorrect response with mixed retrieval metrics (the relevant document was retrieved, but the LLM hallucinated an answer due to being given too much information).
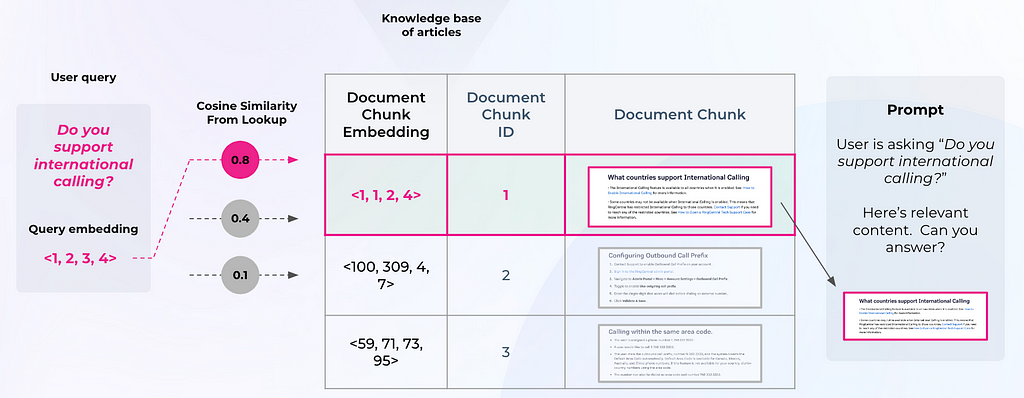
To evaluate an LLM RAG system, you need to both fetch the right context and then generate an appropriate answer. Typically, developers will embed a user query and use it to search a vector database for relevant chunks (see Figure 3). Retrieval performance hinges not only on the returned chunks being semantically similar to the query, but on whether those chunks provide enough relevant information to generate the correct response to the query. Now, you must configure the parameters around your RAG system (type of retrieval, chunk size, and K).
Similarly with our last scenario, we can try editing the prompt template or change out the LLM being used to generate responses. Since the relevant content is retrieved during the document retrieval process but isn’t being surfaced by the LLM, this could be a quick solution. Below is an example of a correct response generated from running a revised prompt template (after iterating on prompt variables, LLM parameters, and the prompt template itself).
When troubleshooting bad responses with mixed performance metrics, we need to first figure out which retrieval metrics are underperforming. The easiest way of doing this is to implement thresholds and monitors. Once you are alerted to a particular underperforming metric you can resolve with specific workflows. Let’s take nDCG for example. nDCG is used to measure the effectiveness of your top ranked documents and takes into account the position of relevant docs, so if you retrieve your relevant document (Hit = ‘True’), you will want to consider implementing a reranking technique to get the relevant documents closer to the top ranked search results.
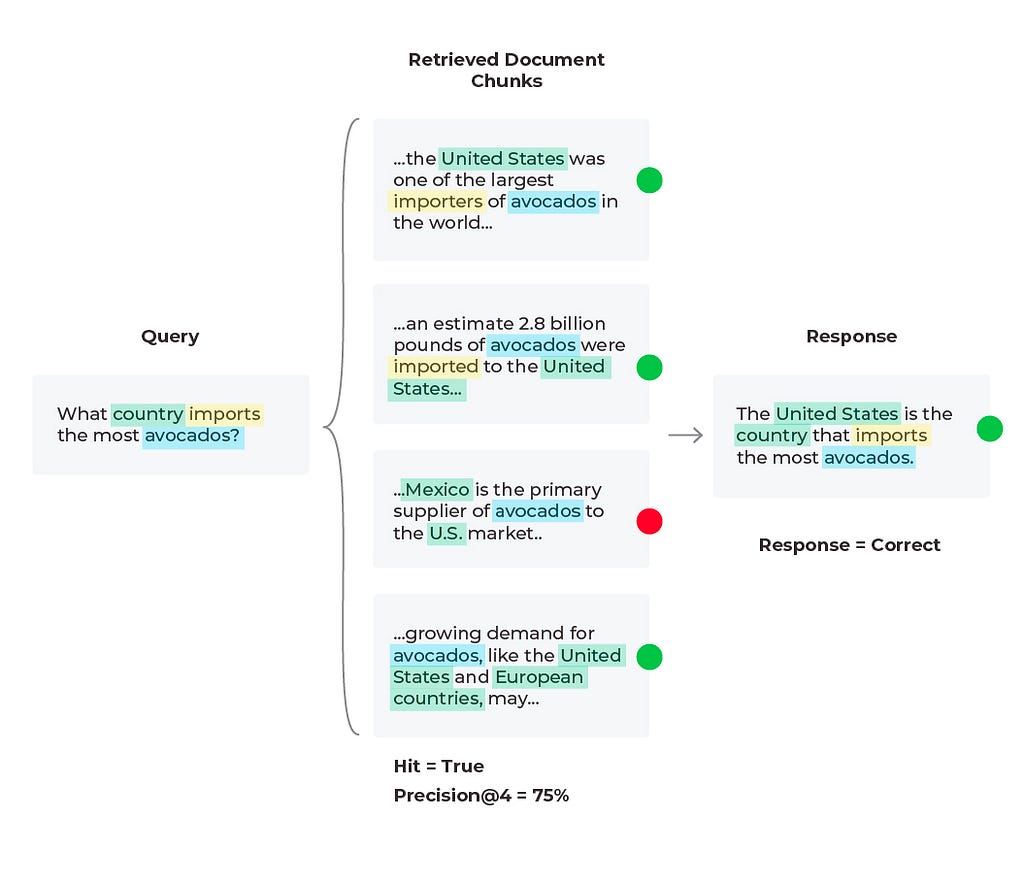
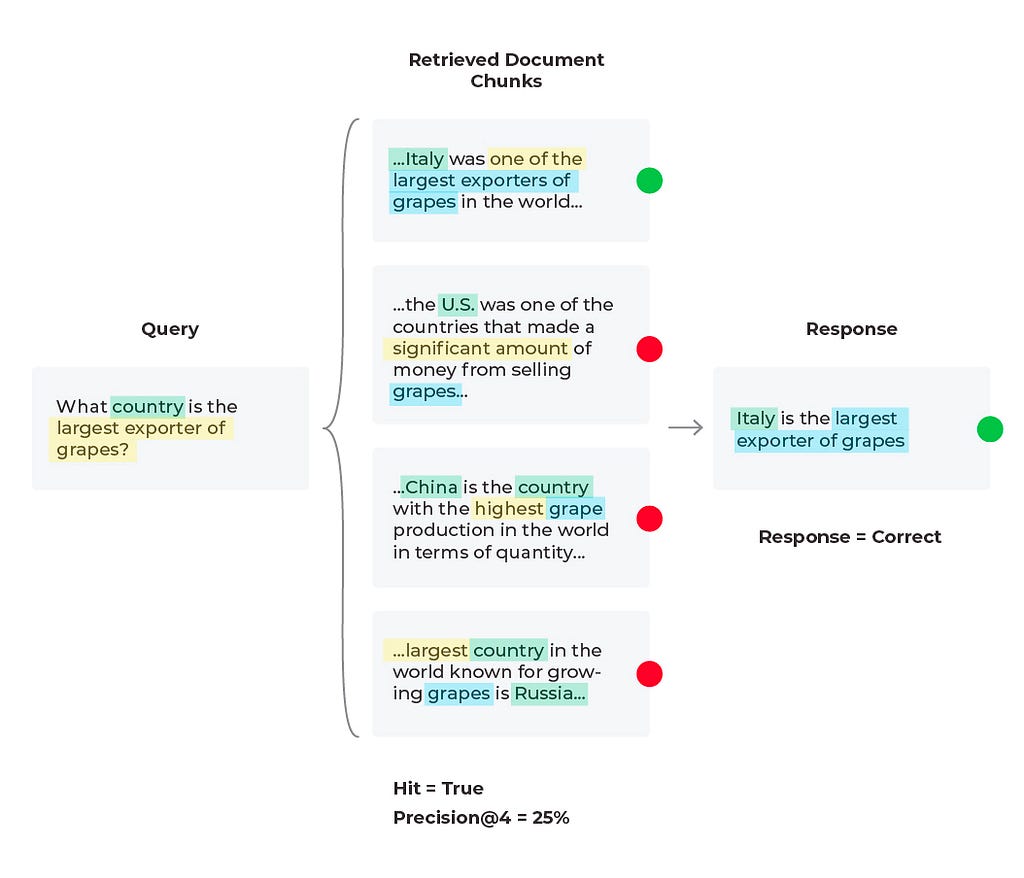
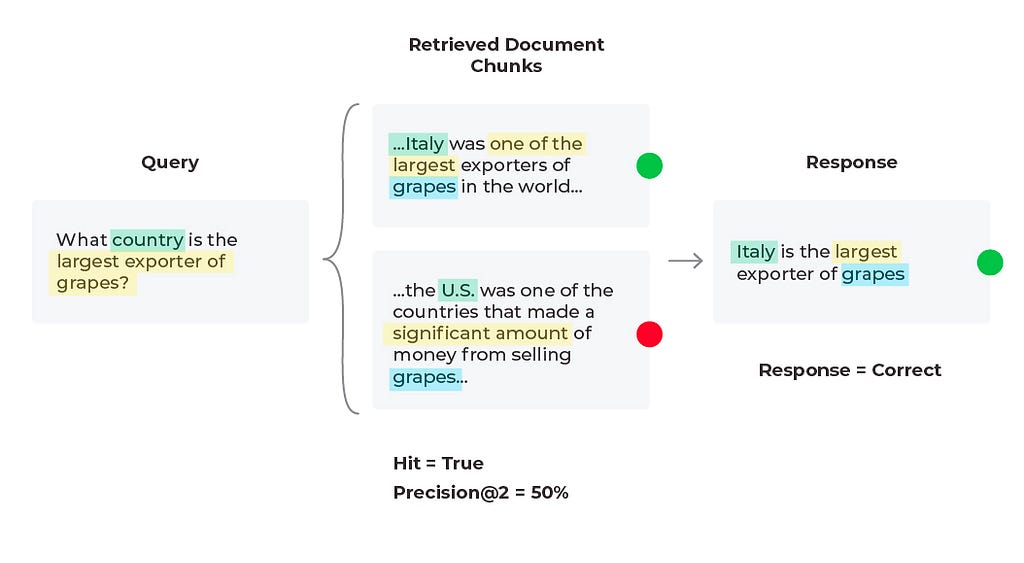
For our current scenario we retrieved a relevant document (Hit = ‘True’), and that document is in the first position, so let’s try and improve the precision (percent relevant documents) up to ‘K’ retrieved documents. Currently our Precision@4 is 25%, but if we used only the first two relevant documents then Precision@2 = 50% since half of the documents are relevant. This change leads to the correct response from the LLM since it is given less information, but more relevant information proportionally.
Essentially what we were seeing here is a common problem in RAG known as lost in the middle, when your LLM is overwhelmed with too much information that is not always relevant and then is unable to give the best answer possible. From our diagram, we see that adjusting your chunk size is one of the first things many teams do to improve RAG applications but it’s not always intuitive. With context overflow and lost in the middle problems, more documents isn’t always better, and reranking won’t necessarily improve performance. To evaluate which chunk size works best, you need to define an eval benchmark and do a sweep over chunk sizes and top-k values. In addition to experimenting with chunking strategies, testing out different text extraction techniques and embedding methods will also improve overall RAG performance.
Response and Retrieval Evaluation Metrics Summary
The response and retrieval evaluation metrics and approaches in this piece offer a comprehensive way to view an LLM RAG system’s performance, guiding developers and users in understanding its strengths and limitations. By continually evaluating these systems against these metrics, improvements can be made to enhance RAG’s ability to provide accurate, relevant, and timely information.
Additional advanced methods for improving RAG include re-ranking, metadata attachments, testing out different embedding models, testing out different indexing methods, implementing HyDe, implementing keyword search methods, or implementing Cohere document mode (similar to Hyde). Note that while these more advanced methods (chucking, text extraction, embedding model experimentation) may produce more contextually coherent chunks, these methods are more resource-intensive. Using RAG along with advanced methods can make performance improvements to your LLM system and will continue to do so as long as your retrieval and response metrics are properly monitored and maintained.
Top Evaluation Metrics for RAG Failures was originally published in Towards Data Science on Medium, where people are continuing the conversation by highlighting and responding to this story.

Troubleshoot LLMs and Retrieval Augmented Generation with Retrieval and Response Metrics
If you have been experimenting with large language models (LLMs) for search and retrieval tasks, you have likely come across retrieval augmented generation (RAG) as a technique to add relevant contextual information to LLM generated responses. By connecting an LLM to private data, RAG can enable a better response by feeding relevant data in the context window.
RAG has been shown to be highly effective for complex query answering, knowledge-intensive tasks, and enhancing the precision and relevance of responses for AI models, especially in situations where standalone training data may fall short.
However, these benefits from RAG can only be reaped if you are continuously monitoring your LLM system at common failure points — most notably with response and retrieval evaluation metrics. In this piece we will go through the best workflows for troubleshooting poor retrieval and response metrics.
Troubleshooting Retrieval and Responses
It’s worth remembering that RAG works best when required information is readily available. Whether relevant documents are available focuses RAG system evaluations on two critical aspects:
- Retrieval Evaluation: To assess the accuracy and relevance of the documents that were retrieved
- Response Evaluation: Measure the appropriateness of the response generated by the system when the context was provided
Table 1: Response Evaluation Metrics
Table 2: Retrieval Evaluation Metrics
Troubleshooting RAG Workflows
Let’s review three potential scenarios to troubleshoot poor LLM performance based on the flow diagram.
Scenario 1: Good Response, Good Retrieval
In this scenario everything in the LLM application is acting as expected and we have a good response with a good retrieval. We find our response evaluation is “correct” and our “Hit = True.” Hit is a binary metric, where “True” means the relevant document was retrieved and “False” would mean the relevant document was not retrieved. Note that the aggregate statistic for Hit is the Hit rate (percent of queries that have relevant context).
For our response evaluations, correctness is an evaluation metric that can be done simply with a combination of the input (query), output (response), and context as can be seen in Table 1. Several of these evaluation criteria do not require user labeled ground-truth labels since LLMs can also be used to generate labels, scores, and explanations with tools like the OpenAI function calling, below is an example prompt template.
These evals can be formatted as numeric, categorical (binary and multi-class) and multi-output (multiple scores or labels) — with categorical-binary being the most commonly used and numeric being the least commonly used.
Scenario 2: Bad Response, Bad Retrieval
In this scenario we find that the response is incorrect and the relevant content was not received. Based on the query we see that the content wasn’t received because there is no solution to the query. The LLM cannot predict future purchases no matter what documents it is supplied. However, the LLM can generate a better response than to hallucinate an answer. Here it would be to experiment with the prompt that is generating the response by simply adding a line to the LLM prompt template of “if relevant content is not provided and no conclusive solution is found, respond that the answer is unknown.” In some cases the correct answer is that the answer does not exist.
Scenario 3: Bad Response, Mixed Retrieval Metrics
In this third scenario, we see an incorrect response with mixed retrieval metrics (the relevant document was retrieved, but the LLM hallucinated an answer due to being given too much information).
To evaluate an LLM RAG system, you need to both fetch the right context and then generate an appropriate answer. Typically, developers will embed a user query and use it to search a vector database for relevant chunks (see Figure 3). Retrieval performance hinges not only on the returned chunks being semantically similar to the query, but on whether those chunks provide enough relevant information to generate the correct response to the query. Now, you must configure the parameters around your RAG system (type of retrieval, chunk size, and K).
Similarly with our last scenario, we can try editing the prompt template or change out the LLM being used to generate responses. Since the relevant content is retrieved during the document retrieval process but isn’t being surfaced by the LLM, this could be a quick solution. Below is an example of a correct response generated from running a revised prompt template (after iterating on prompt variables, LLM parameters, and the prompt template itself).
When troubleshooting bad responses with mixed performance metrics, we need to first figure out which retrieval metrics are underperforming. The easiest way of doing this is to implement thresholds and monitors. Once you are alerted to a particular underperforming metric you can resolve with specific workflows. Let’s take nDCG for example. nDCG is used to measure the effectiveness of your top ranked documents and takes into account the position of relevant docs, so if you retrieve your relevant document (Hit = ‘True’), you will want to consider implementing a reranking technique to get the relevant documents closer to the top ranked search results.
For our current scenario we retrieved a relevant document (Hit = ‘True’), and that document is in the first position, so let’s try and improve the precision (percent relevant documents) up to ‘K’ retrieved documents. Currently our Precision@4 is 25%, but if we used only the first two relevant documents then Precision@2 = 50% since half of the documents are relevant. This change leads to the correct response from the LLM since it is given less information, but more relevant information proportionally.
Essentially what we were seeing here is a common problem in RAG known as lost in the middle, when your LLM is overwhelmed with too much information that is not always relevant and then is unable to give the best answer possible. From our diagram, we see that adjusting your chunk size is one of the first things many teams do to improve RAG applications but it’s not always intuitive. With context overflow and lost in the middle problems, more documents isn’t always better, and reranking won’t necessarily improve performance. To evaluate which chunk size works best, you need to define an eval benchmark and do a sweep over chunk sizes and top-k values. In addition to experimenting with chunking strategies, testing out different text extraction techniques and embedding methods will also improve overall RAG performance.
Response and Retrieval Evaluation Metrics Summary
The response and retrieval evaluation metrics and approaches in this piece offer a comprehensive way to view an LLM RAG system’s performance, guiding developers and users in understanding its strengths and limitations. By continually evaluating these systems against these metrics, improvements can be made to enhance RAG’s ability to provide accurate, relevant, and timely information.
Additional advanced methods for improving RAG include re-ranking, metadata attachments, testing out different embedding models, testing out different indexing methods, implementing HyDe, implementing keyword search methods, or implementing Cohere document mode (similar to Hyde). Note that while these more advanced methods (chucking, text extraction, embedding model experimentation) may produce more contextually coherent chunks, these methods are more resource-intensive. Using RAG along with advanced methods can make performance improvements to your LLM system and will continue to do so as long as your retrieval and response metrics are properly monitored and maintained.
Top Evaluation Metrics for RAG Failures was originally published in Towards Data Science on Medium, where people are continuing the conversation by highlighting and responding to this story.
Denial of responsibility! Techno Blender is an automatic aggregator of the all world’s media. In each content, the hyperlink to the primary source is specified. All trademarks belong to their rightful owners, all materials to their authors. If you are the owner of the content and do not want us to publish your materials, please contact us by email – [email protected]. The content will be deleted within 24 hours.