
Visualize your RAG Data — Evaluate your Retrieval-Augmented Generation System with Ragas
Visualize your RAG Data — Evaluate your Retrieval-Augmented Generation System with Ragas
How to use UMAP dimensionality reduction for Embeddings to show multiple evaluation Questions and their relationships to source documents with Ragas, OpenAI, Langchain and ChromaDB
Retrieval-Augmented Generation (RAG) adds a retrieval step to the workflow of an LLM, enabling it to query relevant data from additional sources like private documents when responding to questions and queries [1]. This workflow does not require costly training or fine-tuning of LLMs on the additional documents. The documents are split into snippets, which are then indexed, often using a compact ML-generated vector representation (embedding). Snippets with similar content will be in proximity to each other in this embedding space.
The RAG application projects the user-provided questions into the embedding space to retrieve relevant document snippets based on their distance to the question. The LLM can use the retrieved information to answer the query and to substantiate its conclusion by presenting the snippets as references.
The evaluation of a RAG application is challenging [2]. Different approaches exist: on one hand, there are methods where the answer as ground truth must be provided by the developer; on the other hand, the answer (and the question) can also be generated by another LLM. One of the largest open-source systems for LLM-supported answering is Ragas [4](Retrieval-Augmented Generation Assessment), which provides
- Methods for generating test data based on the documents and
- Evaluations based on different metrics for evaluating retrieval and generation steps one-by-one and end-to-end.
In this article, you will learn
- How to briefly build a RAG system for Formula One (see the previous article Visualize your RAG Data — EDA for Retrieval-Augmented Generation for detailed descriptions)
- Generate questions and answers
- Evaluate the RAG system with Ragas
- Most importantly how to visualize the results with Renumics Spotlight and interpret the results.
Get your environment ready
Start a notebook and install the required python packages
!pip install langchain langchain-openai chromadb renumics-spotlight
%env OPENAI_API_KEY=<your-api-key>
This tutorial uses the following python packages:
- Langchain: A framework to integrate language models and RAG components, making the setup process smoother.
- Renumics-Spotlight: A visualization tool to interactively explore unstructured ML datasets.
- Ragas: a framework that helps you evaluate your RAG pipelines
Disclaimer: The author of this article is also one of the developers of Spotlight.
Prepare documents and embeddings for the dataset
You can use your own RAG Application, skip to the next part to learn how to evaluate, extract and visualize.
Or you can use the RAG application from the last article with our prepared dataset of all Formula One articles of Wikipedia. There you can also insert your own Documents into a ‘docs/’ subfolder.
This dataset is based on articles from Wikipedia and is licensed under the Creative Commons Attribution-ShareAlike License. The original articles and a list of authors can be found on the respective Wikipedia pages.
Now you can use Langchain’s DirectoryLoader to load all files from the docs subdirectory and split the documents in snippets using the RecursiveCharacterTextSpliter. With OpenAIEmbeddings you can create embeddings and store them in a ChromaDB as vector store. For the Chain itself you can use LangChains ChatOpenAI and a ChatPromptTemplate.
The linked code for this article contains all necessary steps and you can find a detailed description of all steps above in the last article.
One important point is, that you should use a hash function to create ids for snippets in ChromaDB. This allows to find the embeddings in the db if you only have the document with its content and metadata. This makes it possible to skip documents that already exist in the database.
import hashlib
import json
from langchain_core.documents import Document

def stable_hash_meta(doc: Document) -> str:
    """
    Stable hash document based on its metadata.
    """
    return hashlib.sha1(json.dumps(doc.metadata, sort_keys=True).encode()).hexdigest()

...
splits = text_splitter.split_documents(docs)
splits_ids = [
    {"doc": split, "id": stable_hash_meta(split.metadata)} for split in splits
]

existing_ids = docs_vectorstore.get()["ids"]
new_splits_ids = [split for split in splits_ids if split["id"] not in existing_ids]

docs_vectorstore.add_documents(
    documents=[split["doc"] for split in new_splits_ids],
    ids=[split["id"] for split in new_splits_ids],
)
docs_vectorstore.persist()
Evaluation Questions
For a common topic like Formula One, one can also use ChatGPT directly to generate general questions. In this article, four methods of question generation are used:
- GPT4: 30 questions were generated using ChatGPT 4 with the following prompt “Write 30 question about Formula one”
– Random Example: “Which Formula 1 team is known for its prancing horse logo?” - GPT3.5: Another 199 question were generated with ChatGPT 3.5 with the following prompt “Write 100 question about Formula one” and repeating “Thanks, write another 100 please”
– Example: “”Which driver won the inaugural Formula One World Championship in 1950?” - Ragas_GPT4: 113 questions were generated using Ragas. Ragas utilizes the documents again and its own embedding model to construct a vector database, which is then used to generate questions with GPT4.
– Example: “Can you tell me more about the performance of the Jordan 198 Formula One car in the 1998 World Championship?” - Rags_GPT3.5: 226 additional questions were generated with Ragas — here we use GPT3.5
– Example: “What incident occurred at the 2014 Belgian Grand Prix that led to Hamilton’s retirement from the race?”
from ragas.testset import TestsetGenerator

generator = TestsetGenerator.from_default(
    openai_generator_llm="gpt-3.5-turbo-16k",
    openai_filter_llm="gpt-3.5-turbo-16k"
)

testset_ragas_gpt35 = generator.generate(docs, 100)
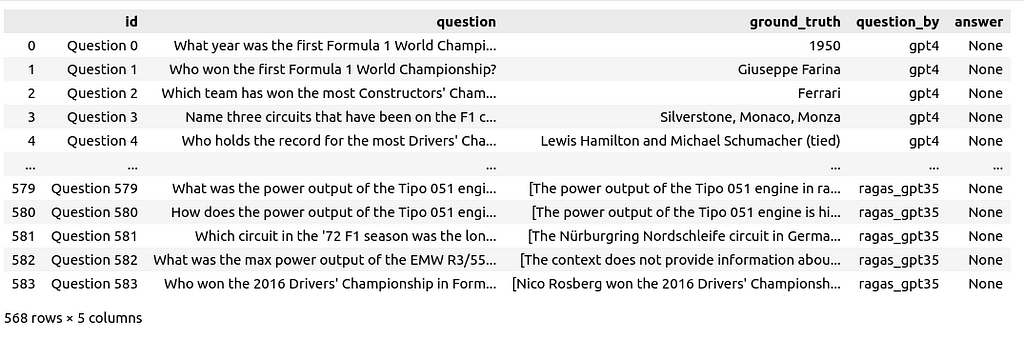
The questions and answers were not reviewed or modified in any way. All questions are combined in a single dataframe with the columns id, question, ground_truth, question_by and answer.
Next, the questions will be posed to the RAG system. For over 500 questions, this can take some time and incur costs. If you ask the questions row-by-row, you can pause and continue the process or recover from a crash without losing the results so far:
for i, row in df_questions_answers.iterrows():
    if row["answer"] is None or pd.isnull(row["answer"]):
        response = rag_chain.invoke(row["question"])

        df_questions_answers.loc[df_questions_answers.index[i], "answer"] = response[
            "answer"
        ]
        df_questions_answers.loc[df_questions_answers.index[i], "source_documents"] = [
            stable_hash_meta(source_document.metadata)
            for source_document in response["source_documents"]
        ]
Not only is the answer stored but also the source IDs of the retrieved document snippets, and their text content as context:
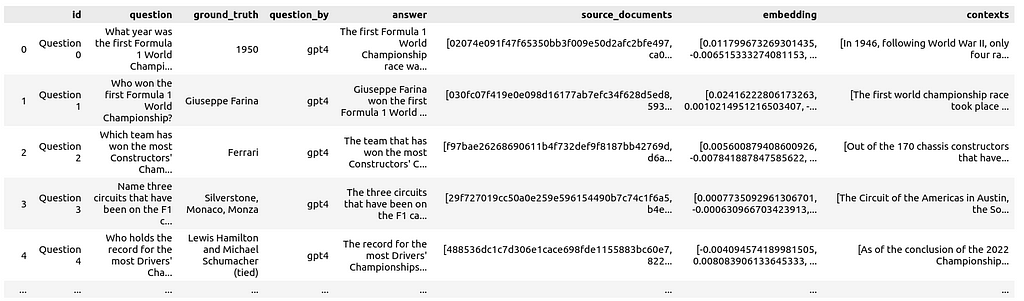
Additionally, the embeddings for all questions are generated and stored in the dataframe as well. This allows for visualizing them alongside the documents.
Evaluation with Ragas
Ragas provides metrics for evaluating each component of your RAG pipeline in isolation and end-to-end metrics for overall performance:
- Context Precision: Uses the question and retrieved contexts to measure the signal-to-noise ratio.
- Context Relevancy: Measures the relevance of the retrieved context to the question, calculated using the question and contexts.
- Context Recall: Based on the ground truth and contexts to check if all relevant information for the answer is retrieved.
- Faithfulness: Utilizes the contexts and answer to measure how factually accurate the generated answer is.
- Answer Relevance: Computed using the question and answer to assess the relevance of the generated answer to the question (does not consider factuality).
- Answer Semantic Similarity: Evaluated using the ground truth and answer to assess the semantic resemblance between the generated and the correct answer.
- Answer Correctness: Relies on the ground truth and answer to measure the accuracy and alignment of the generated answer with the correct one.
- Aspect Critique: Involves analyzing the answer to evaluate submissions based on predefined or custom aspects such as correctness or harmfulness.
For now, we focus on the end-to-end metric of answer correctness. The column names and content in the dataframe are copied and adapted to meet the naming and formatting requirements according to the Ragas API:
# prepare the dataframe for evaluation
df_qa_eval = df_questions_answers.copy()


# adapt the ground truth to the ragas naming and format
df_qa_eval.rename(columns={"ground_truth": "ground_truths"}, inplace=True)
df_qa_eval["ground_truths"] = [
    [gt] if not isinstance(gt, list) else gt for gt in df_qa_eval["ground_truths"]
]
This again can take some time and even more money than just querying your RAG system. Let’s apply the evaluation row-by-row to be able to recover from a crash without losing the results so far:
# evaluate the answer correctness if not already done
fields = ["question", "answer", "contexts", "ground_truths"]
for i, row in df_qa_eval.iterrows():
    if row["answer_correctness"] is None or pd.isnull(row["answer_correctness"]):
        evaluation_result = evaluate(
            Dataset.from_pandas(df_qa_eval.iloc[i : i + 1][fields]),
            [answer_correctness],
        )
        df_qa_eval.loc[i, "answer_correctness"] = evaluation_result[
            "answer_correctness"
        ]
Afterwards, you can store the results in the df_questions_answer dataframe:
df_questions_answers["answer_correctness"] = df_qa_eval["answer_correctness"]
Prepare visualization
To include the document snippets in the visualization, we add references from documents to questions that used the document as a source. Additionally, the count of questions referencing a document is stored:
# Explode 'source_documents' so each document ID is in its own row alongside the question ID
df_questions_exploded = df_qa_eval.explode("source_documents")

# Group by exploded 'source_documents' (document IDs) and aggregate
agg = (
    df_questions_exploded.groupby("source_documents")
    .agg(
        num_questions=("id", "count"),  # Count of questions referencing the document
        question_ids=(
            "id",
            lambda x: list(x),
        ),  # List of question IDs referencing the document
    )
    .reset_index()
    .rename(columns={"source_documents": "id"})
)

# Merge the aggregated information back into df_documents
df_documents_agg = pd.merge(df_docs, agg, on="id", how="left")

# Use apply to replace NaN values with empty lists for 'question_ids'
df_documents_agg["question_ids"] = df_documents_agg["question_ids"].apply(
    lambda x: x if isinstance(x, list) else []
)
# Replace NaN values in 'num_questions' with 0
df_documents_agg["num_questions"] = df_documents_agg["num_questions"].fillna(0)
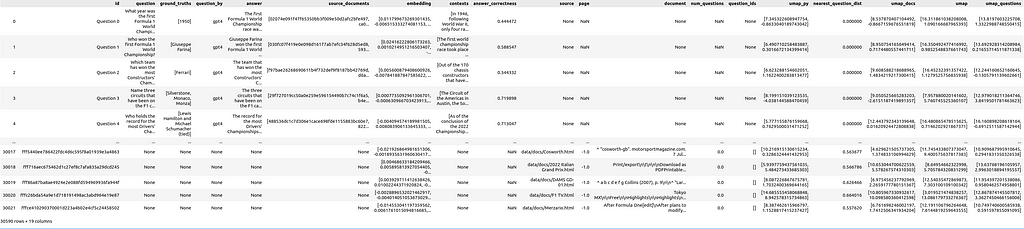
Now concatenate the dataframe of questions with the dataframe of the documents
df = pd.concat([df_qa_eval, df_documents_agg], axis=0)
Additionally, let’s prepare some different UMAP [3] mappings. You could do much the same in the Spotlight GUI later, but doing it upfront can save time.
- umap_all: UMAP with fit and transform applied on all document and question embeddings
- umap_questions: UMAP with fit applied on questions embeddings only and transform applied on both
- umap_docs: UMAP with fit applied on document embeddings only and transform applied on both
We prepare each of the UMAP transformations like this:
umap = UMAP(n_neighbors=20, min_dist=0.15, metric="cosine", random_state=42).fit
umap_all = umap.transform(df["embedding"].values.tolist())
df["umap"] = umap_all.tolist()
Another interesting metric for each of the document snippets is the distance between its embeddings and the embeddings of the nearest question
question_embeddings = np.array(df[df["question"].notna()]["embedding"].tolist())
df["nearest_question_dist"] = [  # brute force, could be optimized using ChromaDB
    np.min([np.linalg.norm(np.array(doc_emb) - question_embeddings)])
    for doc_emb in df["embedding"].values
]
This metric can be helpful to find documents that are not referenced by questions.
Visualize results
If you skipped the previous steps, you can download the dataframe and load it with:
import pandas as pd
df = pd.read_parquet("df_f1_rag_docs_and_questions.parquet")
and start Renumics Spotlight to visualize it with:
from renumics import spotlight

spotlight.show(df)
spotlight.show(
    df,
    layout="/home/markus/Downloads/layout_rag_1.json",
    dtype={x: Embedding for x in df.keys() if "umap" in x},
)
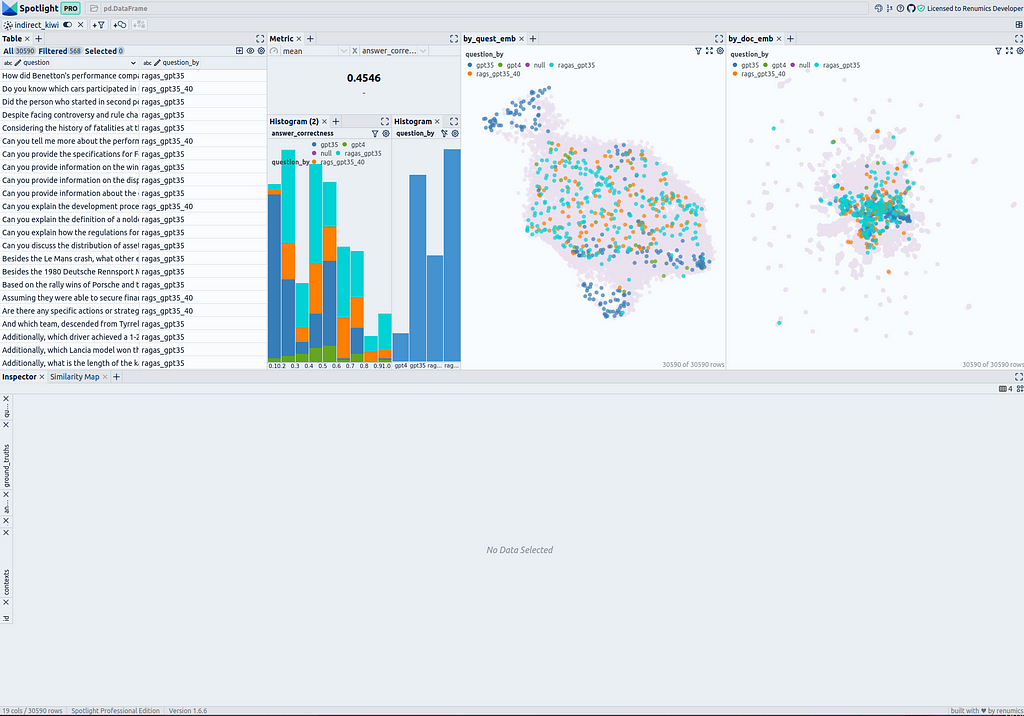
It will open a new brwoser window:
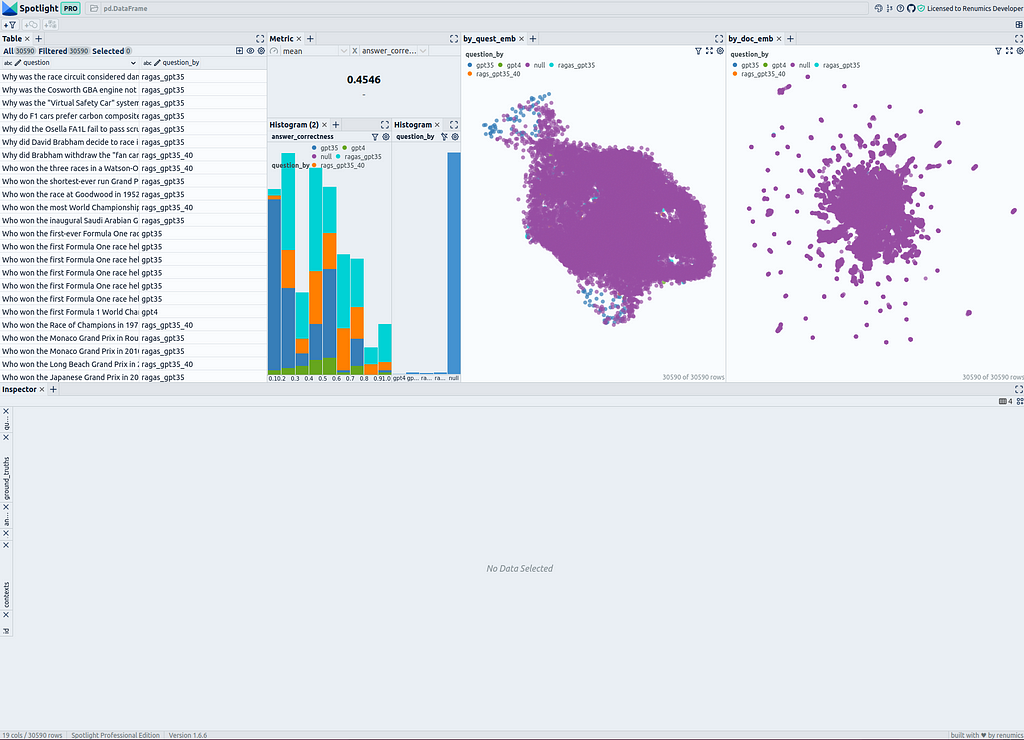
On the top left side, you can see a table of all questions and all document snippets. You can use the “visible columns” button to control which columns of the dataframe are shown in the table. It is useful to create a filter directly that selects only the questions to be able to turn the questions on and off in the visualizations: Select all questions and and then create a filter using the “Create filter from selected row” button.
To the right of the table, the answer correctness is displayed as a metric across all questions. Below there are two histograms; the left one shows the distribution of answer correctness divided into the different methods of question generation. The right one shows the distribution of methods of question generation. Here, it is advisable to create a filter for the questions using the filter button to display only the selected rows (the questions) if needed.
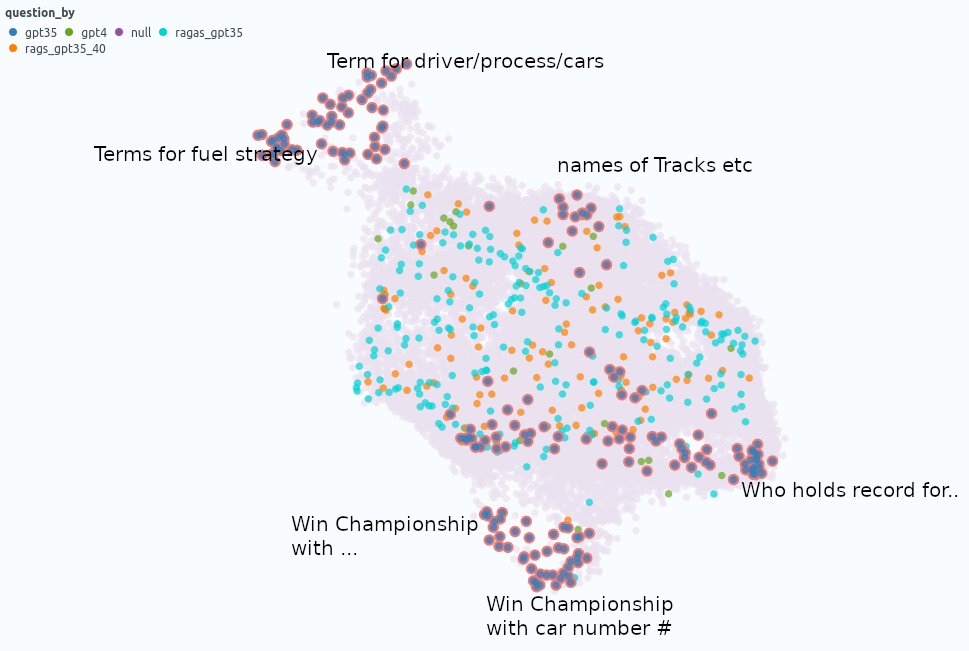
On the right side, there are two similarity maps. The first one uses the umap_questions column and shows the questions and documents based on the transformation applied only to the questions. It is helpful for viewing the distribution of questions independently from the associated documents because this approach allows analysts to identify patterns or clusters within the questions themselves.
The second similarity map shows the questions and documents based on the transformation applied only to the documents (umap_docs). It is useful for viewing the questions in the context of their associated documents. A similarity map that simultaneously transforms questions and documents has proven to be less helpful with a larger number of questions, as more or fewer questions get clustered together and tend to be separated from the documents. Therefore, this representation is omitted here.
Document Embedding Similarity Map: Observations
In the similarity map umap_docs, you can identify areas in the embedding space of the documents that have no neighboring questions. It is even better recognized when selecting nearest_question_dist for coloring.
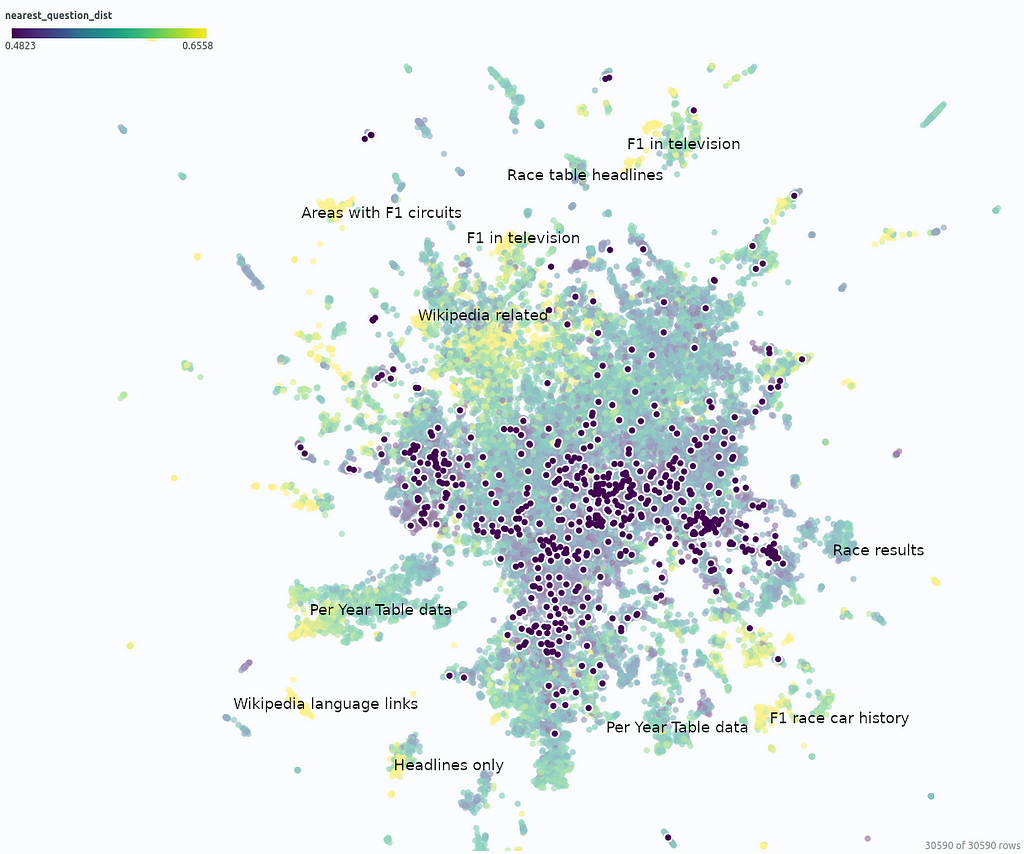
Some clusters can be identified, including snippets that contain only headings or tabular data containing only numbers page by page, whose meaning is lost during splitting. Additionally, many Wikipedia-specific text additions that contain no relevant information, such as links to other languages or editing notes, form clusters with no neighboring questions.
Removing the noise in form of Wikipedia-related text is very simple when using the Wikipedia API. It is probably not particularly necessary, as it mainly costs some space — it is not expected that the RAG result will be particularly worsened by it. However, data contained in large tables are hardly captured by the RAG system and it could ne benifical to extract these using advanced pre-processing methods for Table Extraction and to connect them to the RAG system.
Another point that you can observe in the umap_docs similarity map is how the questions from different sources are distributed.
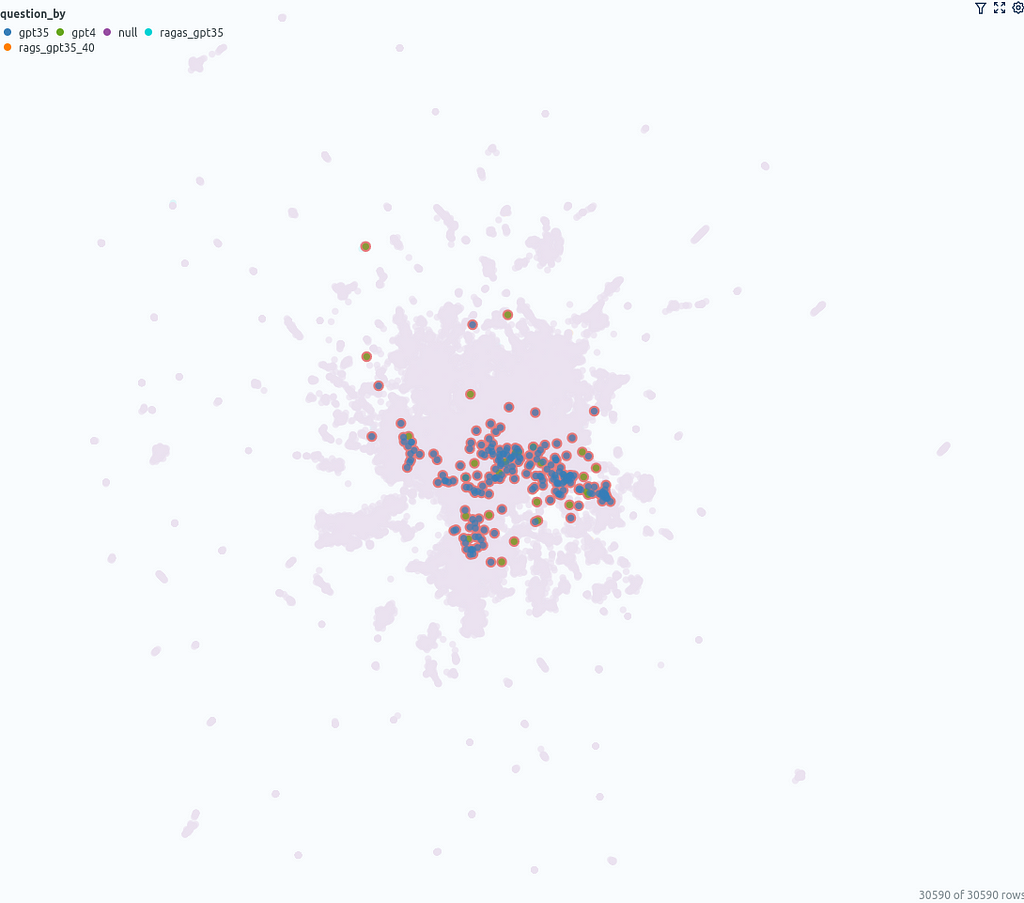
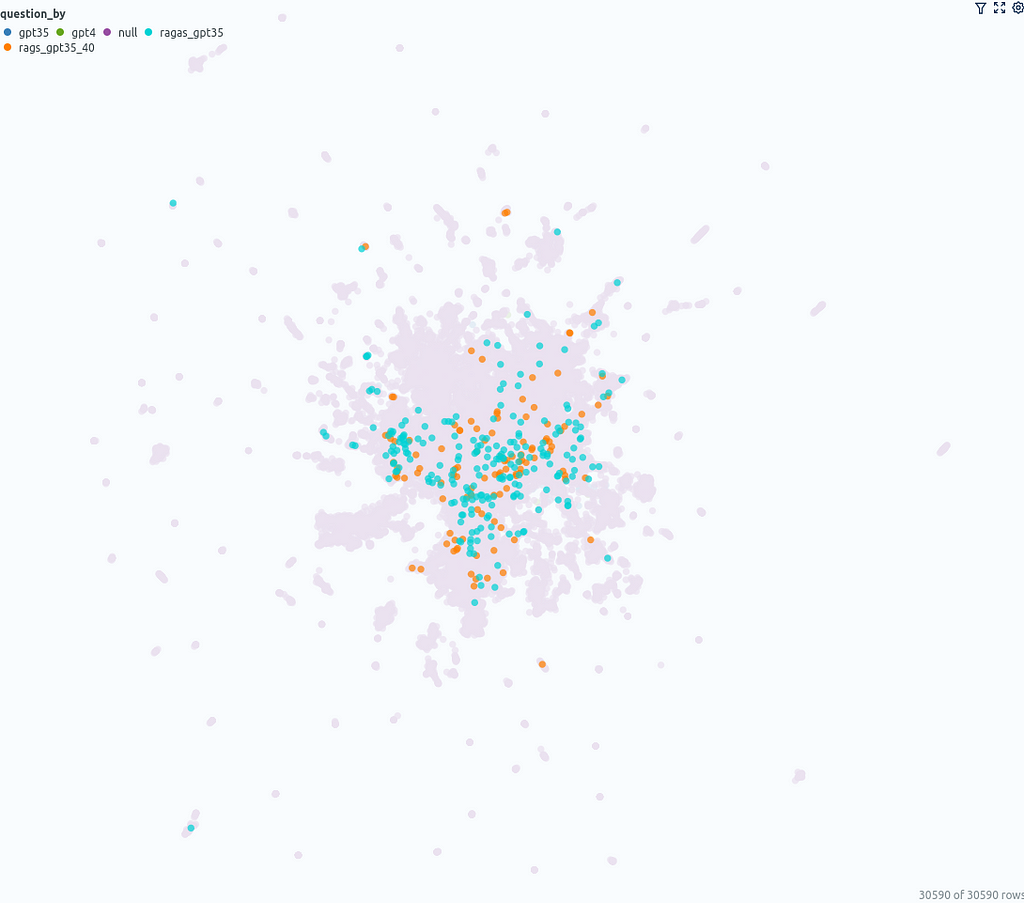
The questions that were directly generated by ChatGPT (GPT-3.5, GPT-4) are located in a more confined area in the center, whereas the questions generated with ragas based on the documents cover a larger area.
Answer correctness histogram
The histogram can be used as a starting point to get an initial impression of the global statistics of the data. Overall, across all questions, the answer correctness is 0.45. For the questions created without ragas, it is 0.36, and for questions with ragas, it is 0.52. It was expected that the system would perform better for questions generated by ragas, as these questions are based on the available data, whereas the questions directly generated by ChatGPT could come from all the data with which ChatGPT was trained.
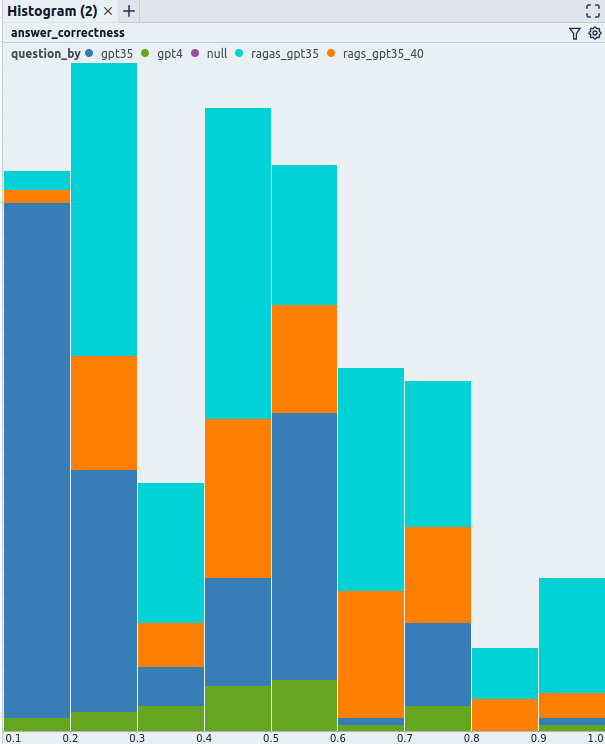
A quick, random manual review of some of the questions/answers and ground truth shows that in the interval ofanswer correctness0.3–0.4, most questions were still correctly answered according to the ground truth. In the interval 0.2–0.3, many incorrect answers are present. In the interval 0.1–0.2, most answers are incorrect. Notably, almost all questions in this range came from GPT-3.5. The two questions in this interval generated with GPT-4 were answered correctly even though they received an answer correctness of below 0.2.
Questions Embedding Similarity Map: Observations
The Questions Embedding Similarity Map can be helpful to dig deeper into answer correctness by examining clusters of similar questions that may cause similar problems.
- Cluster “Term for driver/process/cars”: average answer correctness 0.23: Answers often not precise enough. E.g., Chassis tuning vs. Chassis flexing or brake tuning vs. brake bias adjustment. It is questionable whether these types of questions are suitable for evaluating the system, as it seems very difficult to judge the answers.
- Cluster “Terms for fuel strategy:” average answer correctness0.44, similar to the globalanswer correctness.
- Cluster “Names of tracks”: average answer correctness 0.49, similar to the global answer correctnes.
- Cluster “Who holds the record for…”: average answer correctness 0.44, similar to the global answer correctness.
- Cluster “Win championship with…”: average answer correctnes 0.26 — looks challenging. Questions with many conditions, e.g., “Who is the only driver to win the Formula One World Championship with a British racing license, driving for an Italian team with an American engine.” Extended RAG methods like Multi Query might help improve here.
- Cluster “Who is the only driver to win… with a car bearing the number <number>”: average answer correctness 0.23 — looks like GPT-3.5 was lazy here, repeating the same question with different numbers, even though most ground truth entries are wrong!
Conclusion
In conclusion, utilizing UMAP-based visualizations offers a interesting approach to dig deeper than just analyzing global metrics. The document embedding similarity map gives a good overview, illustrating the clustering of similar documents and their relation to evaluation questions. The question similarity map reveals patterns that allow the differentiation and analysis of questions in conjunction with quality metrics to enable insight generation. Follow the Visualize results section to apply the visualization on your evaluation strategy — what insights will you uncover?
I am a professional with expertise in creating advanced software solutions for the interactive exploration of unstructured data. I write about unstructured data and use powerful visualization tools to analyze and make informed decisions.
References
[1] Yunfan Gao, Yun Xiong, Xinyu Gao, Kangxiang Jia, Jinliu Pan, Yuxi Bi, Yi Dai, Jiawei Sun, Qianyu Guo, Meng Wang, Haofen Wang: Retrieval-Augmented Generation for Large Language Models: A Survey (2024), arxiv
[2] Yixuan Tang, Yi Yang: MultiHop-RAG: Benchmarking Retrieval-Augmented Generation for Multi-Hop Queries (2021), arXiv
[3] Leland McInnes, John Healy, James Melville: UMAP: Uniform Manifold Approximation and Projection for Dimension Reduction (2018), arXiv
[4] Shahul Es, Jithin James, Luis Espinosa-Anke, Steven Schockaert: RAGAS: Automated Evaluation of Retrieval Augmented Generation (2023), arXiv
Visualize your RAG Data — Evaluate your Retrieval-Augmented Generation System with Ragas was originally published in Towards Data Science on Medium, where people are continuing the conversation by highlighting and responding to this story.
Visualize your RAG Data — Evaluate your Retrieval-Augmented Generation System with Ragas
How to use UMAP dimensionality reduction for Embeddings to show multiple evaluation Questions and their relationships to source documents with Ragas, OpenAI, Langchain and ChromaDB
Retrieval-Augmented Generation (RAG) adds a retrieval step to the workflow of an LLM, enabling it to query relevant data from additional sources like private documents when responding to questions and queries [1]. This workflow does not require costly training or fine-tuning of LLMs on the additional documents. The documents are split into snippets, which are then indexed, often using a compact ML-generated vector representation (embedding). Snippets with similar content will be in proximity to each other in this embedding space.
The RAG application projects the user-provided questions into the embedding space to retrieve relevant document snippets based on their distance to the question. The LLM can use the retrieved information to answer the query and to substantiate its conclusion by presenting the snippets as references.
The evaluation of a RAG application is challenging [2]. Different approaches exist: on one hand, there are methods where the answer as ground truth must be provided by the developer; on the other hand, the answer (and the question) can also be generated by another LLM. One of the largest open-source systems for LLM-supported answering is Ragas [4](Retrieval-Augmented Generation Assessment), which provides
- Methods for generating test data based on the documents and
- Evaluations based on different metrics for evaluating retrieval and generation steps one-by-one and end-to-end.
In this article, you will learn
- How to briefly build a RAG system for Formula One (see the previous article Visualize your RAG Data — EDA for Retrieval-Augmented Generation for detailed descriptions)
- Generate questions and answers
- Evaluate the RAG system with Ragas
- Most importantly how to visualize the results with Renumics Spotlight and interpret the results.
Get your environment ready
Start a notebook and install the required python packages
!pip install langchain langchain-openai chromadb renumics-spotlight
%env OPENAI_API_KEY=<your-api-key>
This tutorial uses the following python packages:
- Langchain: A framework to integrate language models and RAG components, making the setup process smoother.
- Renumics-Spotlight: A visualization tool to interactively explore unstructured ML datasets.
- Ragas: a framework that helps you evaluate your RAG pipelines
Disclaimer: The author of this article is also one of the developers of Spotlight.
Prepare documents and embeddings for the dataset
You can use your own RAG Application, skip to the next part to learn how to evaluate, extract and visualize.
Or you can use the RAG application from the last article with our prepared dataset of all Formula One articles of Wikipedia. There you can also insert your own Documents into a ‘docs/’ subfolder.
This dataset is based on articles from Wikipedia and is licensed under the Creative Commons Attribution-ShareAlike License. The original articles and a list of authors can be found on the respective Wikipedia pages.
Now you can use Langchain’s DirectoryLoader to load all files from the docs subdirectory and split the documents in snippets using the RecursiveCharacterTextSpliter. With OpenAIEmbeddings you can create embeddings and store them in a ChromaDB as vector store. For the Chain itself you can use LangChains ChatOpenAI and a ChatPromptTemplate.
The linked code for this article contains all necessary steps and you can find a detailed description of all steps above in the last article.
One important point is, that you should use a hash function to create ids for snippets in ChromaDB. This allows to find the embeddings in the db if you only have the document with its content and metadata. This makes it possible to skip documents that already exist in the database.
import hashlib
import json
from langchain_core.documents import Document

def stable_hash_meta(doc: Document) -> str:
    """
    Stable hash document based on its metadata.
    """
    return hashlib.sha1(json.dumps(doc.metadata, sort_keys=True).encode()).hexdigest()

...
splits = text_splitter.split_documents(docs)
splits_ids = [
    {"doc": split, "id": stable_hash_meta(split.metadata)} for split in splits
]

existing_ids = docs_vectorstore.get()["ids"]
new_splits_ids = [split for split in splits_ids if split["id"] not in existing_ids]

docs_vectorstore.add_documents(
    documents=[split["doc"] for split in new_splits_ids],
    ids=[split["id"] for split in new_splits_ids],
)
docs_vectorstore.persist()
Evaluation Questions
For a common topic like Formula One, one can also use ChatGPT directly to generate general questions. In this article, four methods of question generation are used:
- GPT4: 30 questions were generated using ChatGPT 4 with the following prompt “Write 30 question about Formula one”
– Random Example: “Which Formula 1 team is known for its prancing horse logo?” - GPT3.5: Another 199 question were generated with ChatGPT 3.5 with the following prompt “Write 100 question about Formula one” and repeating “Thanks, write another 100 please”
– Example: “”Which driver won the inaugural Formula One World Championship in 1950?” - Ragas_GPT4: 113 questions were generated using Ragas. Ragas utilizes the documents again and its own embedding model to construct a vector database, which is then used to generate questions with GPT4.
– Example: “Can you tell me more about the performance of the Jordan 198 Formula One car in the 1998 World Championship?” - Rags_GPT3.5: 226 additional questions were generated with Ragas — here we use GPT3.5
– Example: “What incident occurred at the 2014 Belgian Grand Prix that led to Hamilton’s retirement from the race?”
from ragas.testset import TestsetGenerator

generator = TestsetGenerator.from_default(
    openai_generator_llm="gpt-3.5-turbo-16k",
    openai_filter_llm="gpt-3.5-turbo-16k"
)

testset_ragas_gpt35 = generator.generate(docs, 100)
The questions and answers were not reviewed or modified in any way. All questions are combined in a single dataframe with the columns id, question, ground_truth, question_by and answer.
Next, the questions will be posed to the RAG system. For over 500 questions, this can take some time and incur costs. If you ask the questions row-by-row, you can pause and continue the process or recover from a crash without losing the results so far:
for i, row in df_questions_answers.iterrows():
    if row["answer"] is None or pd.isnull(row["answer"]):
        response = rag_chain.invoke(row["question"])

        df_questions_answers.loc[df_questions_answers.index[i], "answer"] = response[
            "answer"
        ]
        df_questions_answers.loc[df_questions_answers.index[i], "source_documents"] = [
            stable_hash_meta(source_document.metadata)
            for source_document in response["source_documents"]
        ]
Not only is the answer stored but also the source IDs of the retrieved document snippets, and their text content as context:
Additionally, the embeddings for all questions are generated and stored in the dataframe as well. This allows for visualizing them alongside the documents.
Evaluation with Ragas
Ragas provides metrics for evaluating each component of your RAG pipeline in isolation and end-to-end metrics for overall performance:
- Context Precision: Uses the question and retrieved contexts to measure the signal-to-noise ratio.
- Context Relevancy: Measures the relevance of the retrieved context to the question, calculated using the question and contexts.
- Context Recall: Based on the ground truth and contexts to check if all relevant information for the answer is retrieved.
- Faithfulness: Utilizes the contexts and answer to measure how factually accurate the generated answer is.
- Answer Relevance: Computed using the question and answer to assess the relevance of the generated answer to the question (does not consider factuality).
- Answer Semantic Similarity: Evaluated using the ground truth and answer to assess the semantic resemblance between the generated and the correct answer.
- Answer Correctness: Relies on the ground truth and answer to measure the accuracy and alignment of the generated answer with the correct one.
- Aspect Critique: Involves analyzing the answer to evaluate submissions based on predefined or custom aspects such as correctness or harmfulness.
For now, we focus on the end-to-end metric of answer correctness. The column names and content in the dataframe are copied and adapted to meet the naming and formatting requirements according to the Ragas API:
# prepare the dataframe for evaluation
df_qa_eval = df_questions_answers.copy()


# adapt the ground truth to the ragas naming and format
df_qa_eval.rename(columns={"ground_truth": "ground_truths"}, inplace=True)
df_qa_eval["ground_truths"] = [
    [gt] if not isinstance(gt, list) else gt for gt in df_qa_eval["ground_truths"]
]
This again can take some time and even more money than just querying your RAG system. Let’s apply the evaluation row-by-row to be able to recover from a crash without losing the results so far:
# evaluate the answer correctness if not already done
fields = ["question", "answer", "contexts", "ground_truths"]
for i, row in df_qa_eval.iterrows():
    if row["answer_correctness"] is None or pd.isnull(row["answer_correctness"]):
        evaluation_result = evaluate(
            Dataset.from_pandas(df_qa_eval.iloc[i : i + 1][fields]),
            [answer_correctness],
        )
        df_qa_eval.loc[i, "answer_correctness"] = evaluation_result[
            "answer_correctness"
        ]
Afterwards, you can store the results in the df_questions_answer dataframe:
df_questions_answers["answer_correctness"] = df_qa_eval["answer_correctness"]
Prepare visualization
To include the document snippets in the visualization, we add references from documents to questions that used the document as a source. Additionally, the count of questions referencing a document is stored:
# Explode 'source_documents' so each document ID is in its own row alongside the question ID
df_questions_exploded = df_qa_eval.explode("source_documents")

# Group by exploded 'source_documents' (document IDs) and aggregate
agg = (
    df_questions_exploded.groupby("source_documents")
    .agg(
        num_questions=("id", "count"),  # Count of questions referencing the document
        question_ids=(
            "id",
            lambda x: list(x),
        ),  # List of question IDs referencing the document
    )
    .reset_index()
    .rename(columns={"source_documents": "id"})
)

# Merge the aggregated information back into df_documents
df_documents_agg = pd.merge(df_docs, agg, on="id", how="left")

# Use apply to replace NaN values with empty lists for 'question_ids'
df_documents_agg["question_ids"] = df_documents_agg["question_ids"].apply(
    lambda x: x if isinstance(x, list) else []
)
# Replace NaN values in 'num_questions' with 0
df_documents_agg["num_questions"] = df_documents_agg["num_questions"].fillna(0)
Now concatenate the dataframe of questions with the dataframe of the documents
df = pd.concat([df_qa_eval, df_documents_agg], axis=0)
Additionally, let’s prepare some different UMAP [3] mappings. You could do much the same in the Spotlight GUI later, but doing it upfront can save time.
- umap_all: UMAP with fit and transform applied on all document and question embeddings
- umap_questions: UMAP with fit applied on questions embeddings only and transform applied on both
- umap_docs: UMAP with fit applied on document embeddings only and transform applied on both
We prepare each of the UMAP transformations like this:
umap = UMAP(n_neighbors=20, min_dist=0.15, metric="cosine", random_state=42).fit
umap_all = umap.transform(df["embedding"].values.tolist())
df["umap"] = umap_all.tolist()
Another interesting metric for each of the document snippets is the distance between its embeddings and the embeddings of the nearest question
question_embeddings = np.array(df[df["question"].notna()]["embedding"].tolist())
df["nearest_question_dist"] = [  # brute force, could be optimized using ChromaDB
    np.min([np.linalg.norm(np.array(doc_emb) - question_embeddings)])
    for doc_emb in df["embedding"].values
]
This metric can be helpful to find documents that are not referenced by questions.
Visualize results
If you skipped the previous steps, you can download the dataframe and load it with:
import pandas as pd
df = pd.read_parquet("df_f1_rag_docs_and_questions.parquet")
and start Renumics Spotlight to visualize it with:
from renumics import spotlight

spotlight.show(df)
spotlight.show(
    df,
    layout="/home/markus/Downloads/layout_rag_1.json",
    dtype={x: Embedding for x in df.keys() if "umap" in x},
)
It will open a new brwoser window:
On the top left side, you can see a table of all questions and all document snippets. You can use the “visible columns” button to control which columns of the dataframe are shown in the table. It is useful to create a filter directly that selects only the questions to be able to turn the questions on and off in the visualizations: Select all questions and and then create a filter using the “Create filter from selected row” button.
To the right of the table, the answer correctness is displayed as a metric across all questions. Below there are two histograms; the left one shows the distribution of answer correctness divided into the different methods of question generation. The right one shows the distribution of methods of question generation. Here, it is advisable to create a filter for the questions using the filter button to display only the selected rows (the questions) if needed.
On the right side, there are two similarity maps. The first one uses the umap_questions column and shows the questions and documents based on the transformation applied only to the questions. It is helpful for viewing the distribution of questions independently from the associated documents because this approach allows analysts to identify patterns or clusters within the questions themselves.
The second similarity map shows the questions and documents based on the transformation applied only to the documents (umap_docs). It is useful for viewing the questions in the context of their associated documents. A similarity map that simultaneously transforms questions and documents has proven to be less helpful with a larger number of questions, as more or fewer questions get clustered together and tend to be separated from the documents. Therefore, this representation is omitted here.
Document Embedding Similarity Map: Observations
In the similarity map umap_docs, you can identify areas in the embedding space of the documents that have no neighboring questions. It is even better recognized when selecting nearest_question_dist for coloring.
Some clusters can be identified, including snippets that contain only headings or tabular data containing only numbers page by page, whose meaning is lost during splitting. Additionally, many Wikipedia-specific text additions that contain no relevant information, such as links to other languages or editing notes, form clusters with no neighboring questions.
Removing the noise in form of Wikipedia-related text is very simple when using the Wikipedia API. It is probably not particularly necessary, as it mainly costs some space — it is not expected that the RAG result will be particularly worsened by it. However, data contained in large tables are hardly captured by the RAG system and it could ne benifical to extract these using advanced pre-processing methods for Table Extraction and to connect them to the RAG system.
Another point that you can observe in the umap_docs similarity map is how the questions from different sources are distributed.
The questions that were directly generated by ChatGPT (GPT-3.5, GPT-4) are located in a more confined area in the center, whereas the questions generated with ragas based on the documents cover a larger area.
Answer correctness histogram
The histogram can be used as a starting point to get an initial impression of the global statistics of the data. Overall, across all questions, the answer correctness is 0.45. For the questions created without ragas, it is 0.36, and for questions with ragas, it is 0.52. It was expected that the system would perform better for questions generated by ragas, as these questions are based on the available data, whereas the questions directly generated by ChatGPT could come from all the data with which ChatGPT was trained.
A quick, random manual review of some of the questions/answers and ground truth shows that in the interval ofanswer correctness0.3–0.4, most questions were still correctly answered according to the ground truth. In the interval 0.2–0.3, many incorrect answers are present. In the interval 0.1–0.2, most answers are incorrect. Notably, almost all questions in this range came from GPT-3.5. The two questions in this interval generated with GPT-4 were answered correctly even though they received an answer correctness of below 0.2.
Questions Embedding Similarity Map: Observations
The Questions Embedding Similarity Map can be helpful to dig deeper into answer correctness by examining clusters of similar questions that may cause similar problems.
- Cluster “Term for driver/process/cars”: average answer correctness 0.23: Answers often not precise enough. E.g., Chassis tuning vs. Chassis flexing or brake tuning vs. brake bias adjustment. It is questionable whether these types of questions are suitable for evaluating the system, as it seems very difficult to judge the answers.
- Cluster “Terms for fuel strategy:” average answer correctness0.44, similar to the globalanswer correctness.
- Cluster “Names of tracks”: average answer correctness 0.49, similar to the global answer correctnes.
- Cluster “Who holds the record for…”: average answer correctness 0.44, similar to the global answer correctness.
- Cluster “Win championship with…”: average answer correctnes 0.26 — looks challenging. Questions with many conditions, e.g., “Who is the only driver to win the Formula One World Championship with a British racing license, driving for an Italian team with an American engine.” Extended RAG methods like Multi Query might help improve here.
- Cluster “Who is the only driver to win… with a car bearing the number <number>”: average answer correctness 0.23 — looks like GPT-3.5 was lazy here, repeating the same question with different numbers, even though most ground truth entries are wrong!
Conclusion
In conclusion, utilizing UMAP-based visualizations offers a interesting approach to dig deeper than just analyzing global metrics. The document embedding similarity map gives a good overview, illustrating the clustering of similar documents and their relation to evaluation questions. The question similarity map reveals patterns that allow the differentiation and analysis of questions in conjunction with quality metrics to enable insight generation. Follow the Visualize results section to apply the visualization on your evaluation strategy — what insights will you uncover?
I am a professional with expertise in creating advanced software solutions for the interactive exploration of unstructured data. I write about unstructured data and use powerful visualization tools to analyze and make informed decisions.
References
[1] Yunfan Gao, Yun Xiong, Xinyu Gao, Kangxiang Jia, Jinliu Pan, Yuxi Bi, Yi Dai, Jiawei Sun, Qianyu Guo, Meng Wang, Haofen Wang: Retrieval-Augmented Generation for Large Language Models: A Survey (2024), arxiv
[2] Yixuan Tang, Yi Yang: MultiHop-RAG: Benchmarking Retrieval-Augmented Generation for Multi-Hop Queries (2021), arXiv
[3] Leland McInnes, John Healy, James Melville: UMAP: Uniform Manifold Approximation and Projection for Dimension Reduction (2018), arXiv
[4] Shahul Es, Jithin James, Luis Espinosa-Anke, Steven Schockaert: RAGAS: Automated Evaluation of Retrieval Augmented Generation (2023), arXiv
Visualize your RAG Data — Evaluate your Retrieval-Augmented Generation System with Ragas was originally published in Towards Data Science on Medium, where people are continuing the conversation by highlighting and responding to this story.
Denial of responsibility! Techno Blender is an automatic aggregator of the all world’s media. In each content, the hyperlink to the primary source is specified. All trademarks belong to their rightful owners, all materials to their authors. If you are the owner of the content and do not want us to publish your materials, please contact us by email – [email protected]. The content will be deleted within 24 hours.