
Where Are the Worst Bridges in the U.S.?
A tanker truck carrying gasoline caught fire after a crash on Interstate 95 in Philadelphia on June 11, ultimately leading to the collapse of one of the highway’s bridges. The collapse caused significant disruptions for the approximately 160,000 drivers who travel along that stretch of road daily. The Pennsylvania Department of Transportation (PennDOT) expects the road to reopen by June 25.
Although PennDOT attributed the collapse to the vehicle fire and not a defect in the bridge itself, the incident has drawn attention to the overall condition of U.S. highway bridges—essential infrastructure for millions nationwide.
According to the National Bridge Inspection Standards, states are required to regularly submit inspection reports on the conditions of their highway bridges. The Federal Highway Administration (FHWA), under the Department of Transportation, maintains a comprehensive record of these inspections and categorizes conditions into three levels: “good,” “fair” and “poor.”
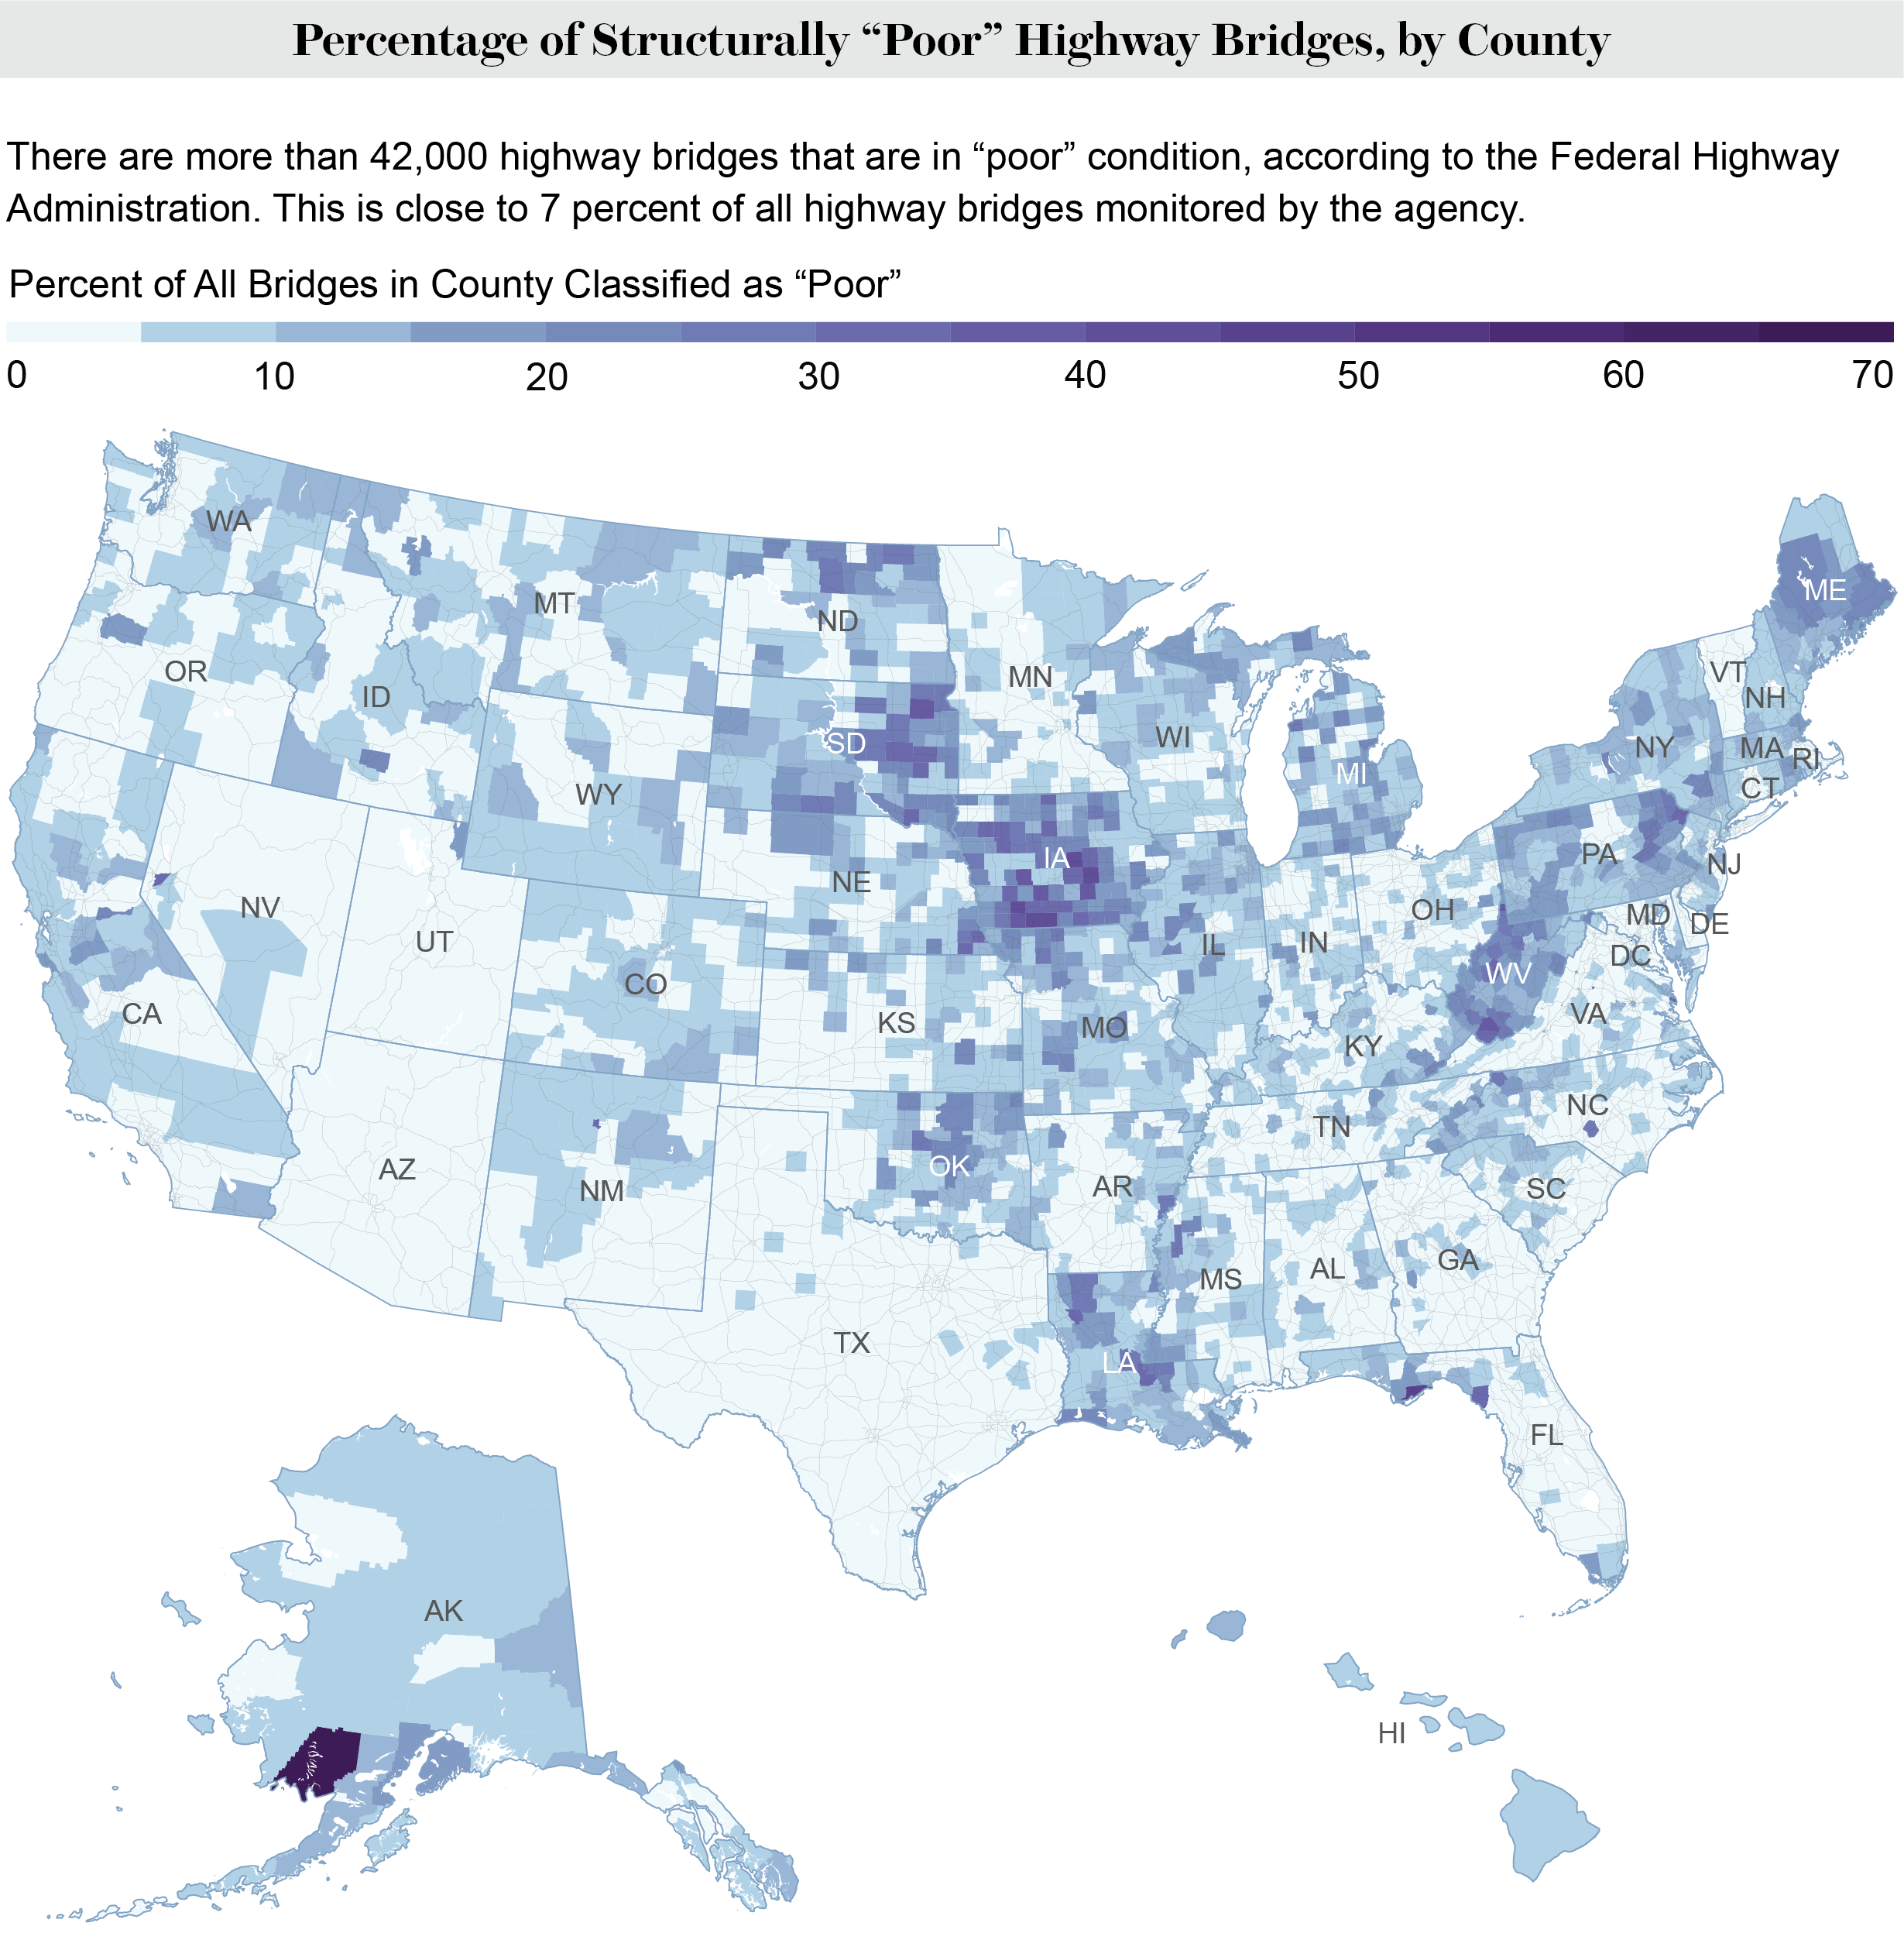
A Scientific American analysis of the database for all 50 states reveals that more than 42,000 bridges across the country have been classified as being in “poor” condition, accounting for nearly 7 percent of all bridges monitored by the agency.
A bridge’s rating is determined by specific FHWA standards for the condition of its various structural components. A poor rating does not necessarily imply immediate safety risks for drivers, but it does indicate the need for close monitoring to prevent unforeseen dangers. At the time of the vehicle fire in Philadelphia, the I-95 bridge was reported to be in good condition.
Some states, counties and county equivalents possess many more of the bridges that are in poor condition than others. Iowa particularly stands out as hosting seven of the top 10 counties with the highest proportion of poor bridges. The Dillingham Census Area, Alaska, Franklin County, Florida, and the city of Falls Church, Va., also made the list of the counties and their equivalents with the most poor bridges.
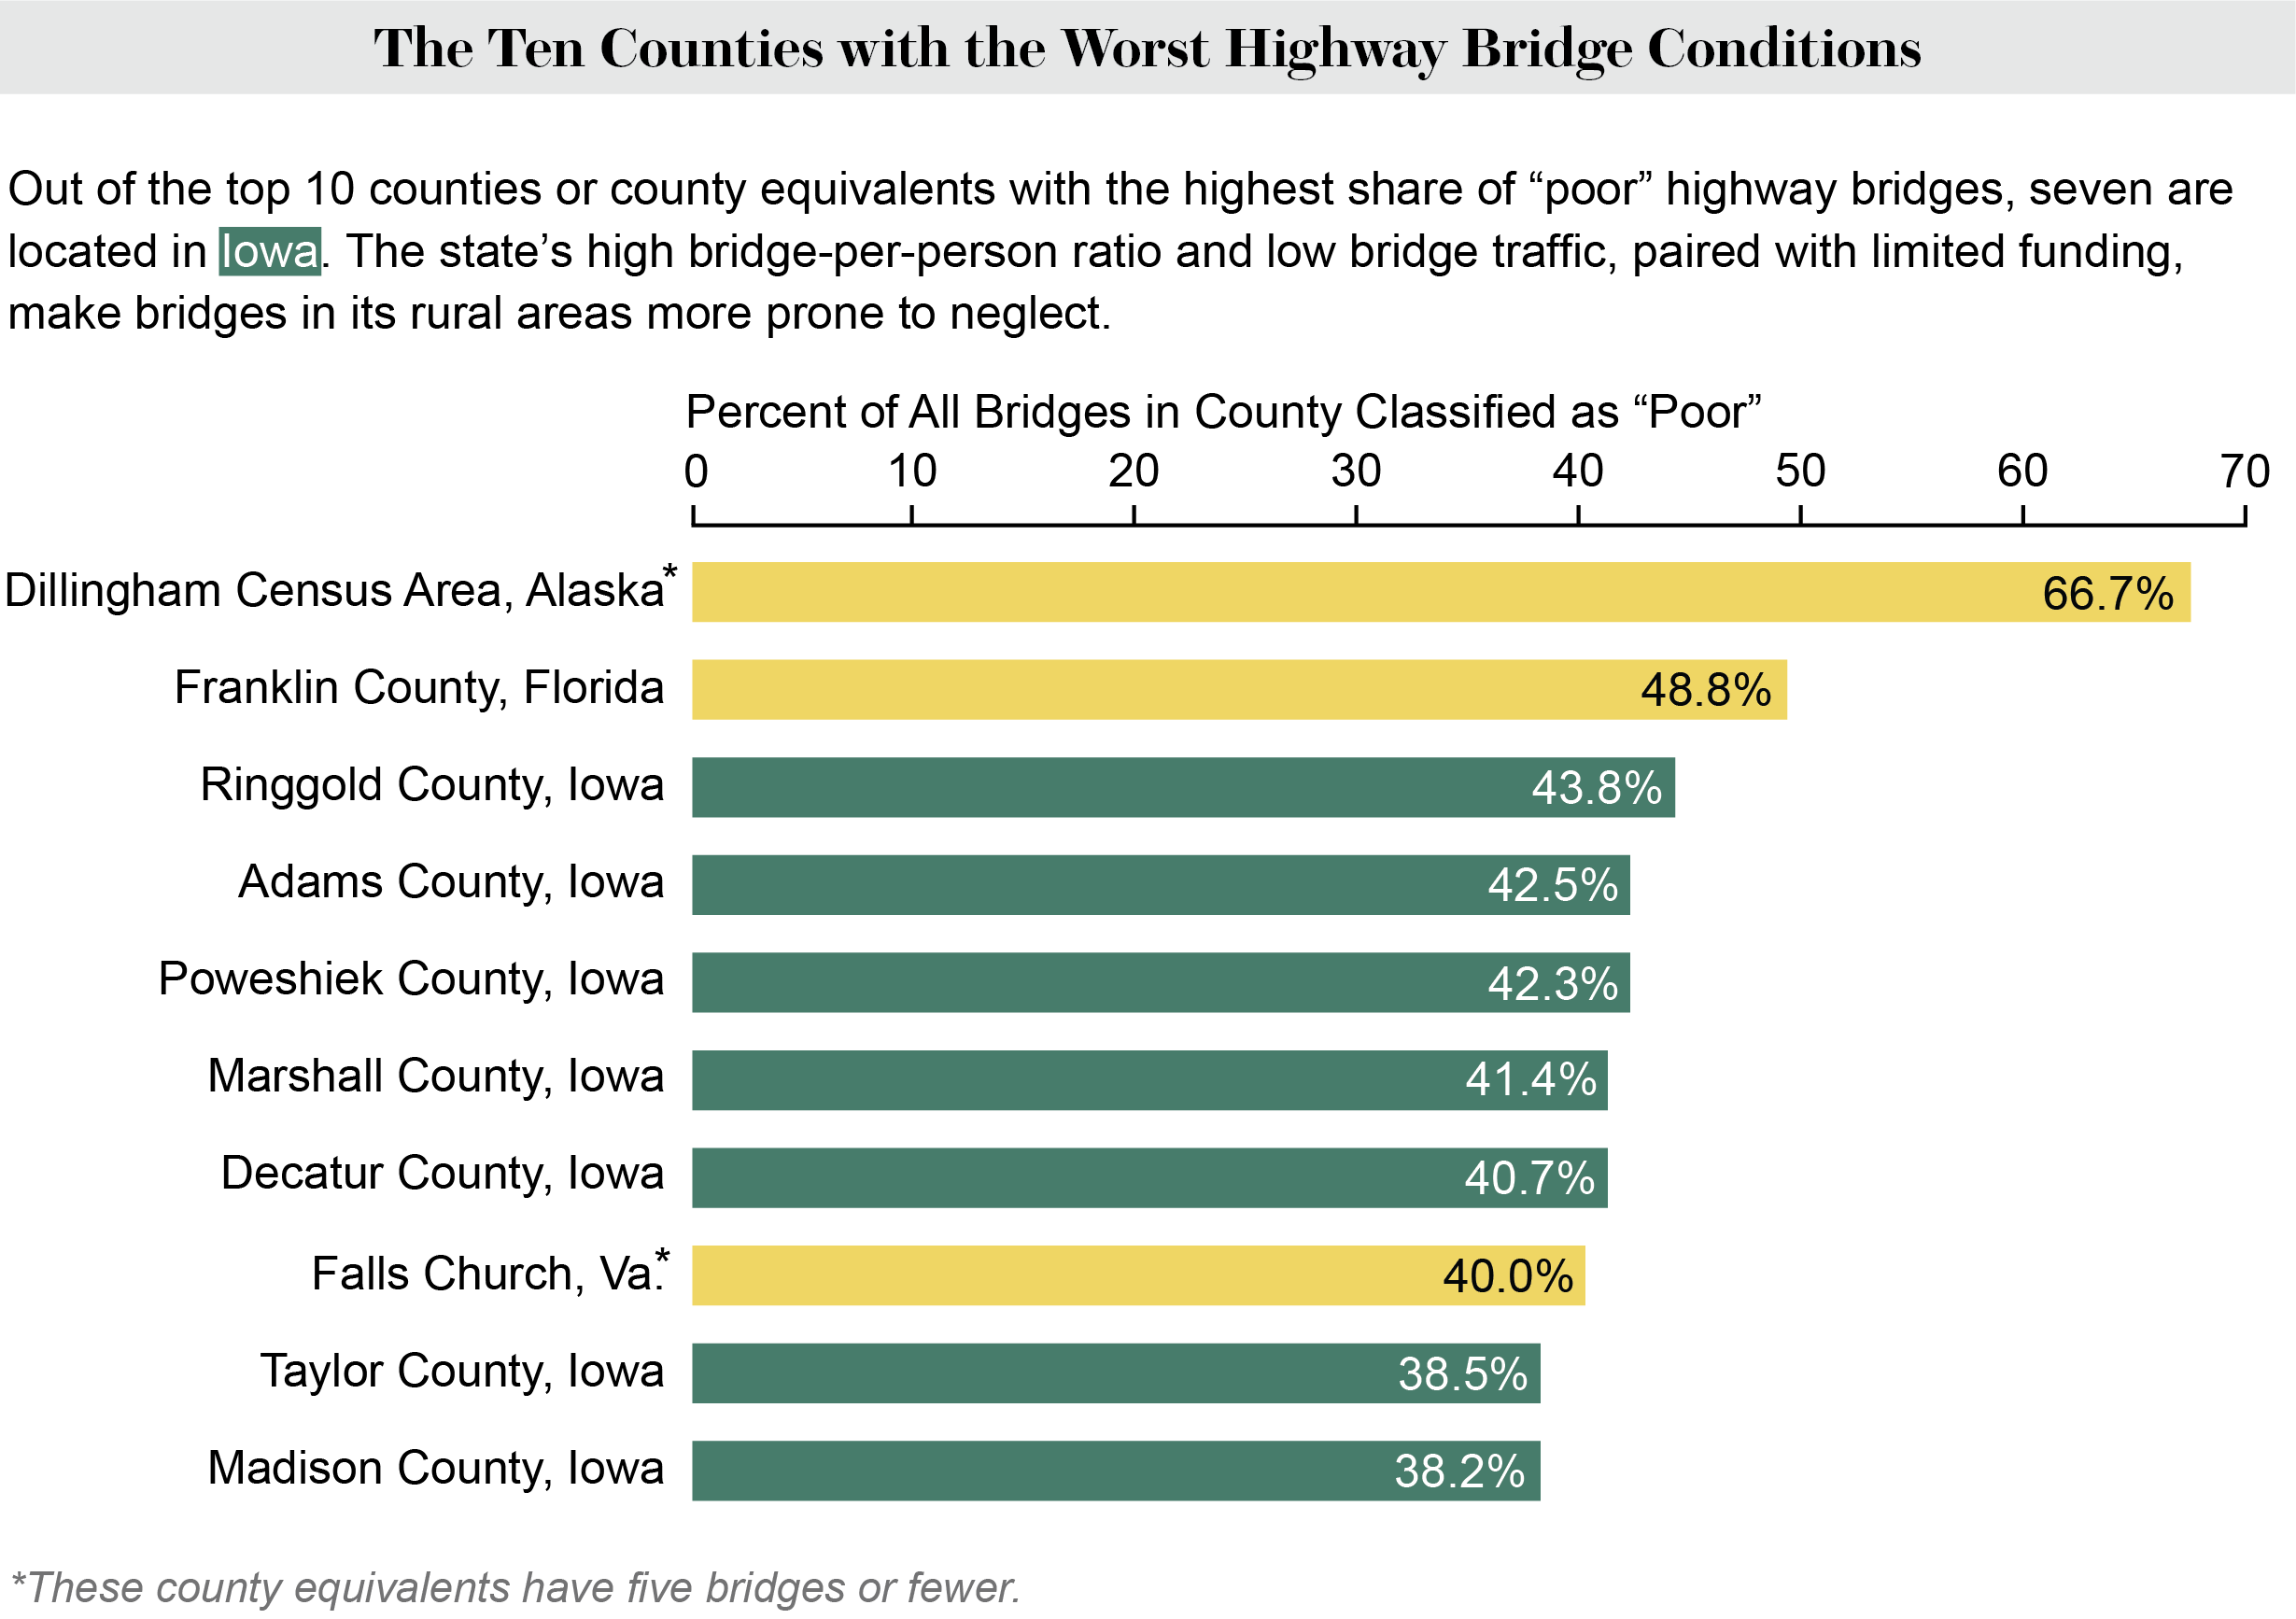
Scott Neubauer, a bridge maintenance and inspection engineer at the Iowa Department of Transportation, explains that Iowa’s extensive number of bridges and low population mean that many of the state’s bridges see minimal traffic. “Some bridges only see 15 to 30 vehicles passing through in a day,” he says. With a high price tag for replacing and upgrading highways, Neubauer adds, it is difficult to prioritize the upkeep of low-traffic bridges over busier state highways.
Though the Federal Highway Administration collects the inspection records at a federal level, it is ultimately up to the state to make sure that its bridges are in good health. “We are doing the best we can with the funds we have,” Neubauer says.
The data from three territories—Guam, Puerto Rico and the U.S. Virgin Islands—were available but not initially included in Scientific American’s top 10 list. If they were included, however, several counties in Puerto Rico would surpass Iowa and Alaska. The island suffered a series of devastating natural disasters in recent years, resulting in the destruction of many bridges and roads.
Diana G. Ramirez-Rios, an assistant professor at the University at Buffalo, whose research includes transportation access issues in Puerto Rico, says that the island has yet to recover from the disastrous impacts of Hurricanes Irma and Maria in 2017. Many of the temporary, replacement bridges that were built after 2017 failed again later as a result of another hurricane. “The priority is to ensure communities are well-connected with permanent infrastructure solutions,” she says.
A tanker truck carrying gasoline caught fire after a crash on Interstate 95 in Philadelphia on June 11, ultimately leading to the collapse of one of the highway’s bridges. The collapse caused significant disruptions for the approximately 160,000 drivers who travel along that stretch of road daily. The Pennsylvania Department of Transportation (PennDOT) expects the road to reopen by June 25.
Although PennDOT attributed the collapse to the vehicle fire and not a defect in the bridge itself, the incident has drawn attention to the overall condition of U.S. highway bridges—essential infrastructure for millions nationwide.
According to the National Bridge Inspection Standards, states are required to regularly submit inspection reports on the conditions of their highway bridges. The Federal Highway Administration (FHWA), under the Department of Transportation, maintains a comprehensive record of these inspections and categorizes conditions into three levels: “good,” “fair” and “poor.”
A Scientific American analysis of the database for all 50 states reveals that more than 42,000 bridges across the country have been classified as being in “poor” condition, accounting for nearly 7 percent of all bridges monitored by the agency.
A bridge’s rating is determined by specific FHWA standards for the condition of its various structural components. A poor rating does not necessarily imply immediate safety risks for drivers, but it does indicate the need for close monitoring to prevent unforeseen dangers. At the time of the vehicle fire in Philadelphia, the I-95 bridge was reported to be in good condition.
Some states, counties and county equivalents possess many more of the bridges that are in poor condition than others. Iowa particularly stands out as hosting seven of the top 10 counties with the highest proportion of poor bridges. The Dillingham Census Area, Alaska, Franklin County, Florida, and the city of Falls Church, Va., also made the list of the counties and their equivalents with the most poor bridges.
Scott Neubauer, a bridge maintenance and inspection engineer at the Iowa Department of Transportation, explains that Iowa’s extensive number of bridges and low population mean that many of the state’s bridges see minimal traffic. “Some bridges only see 15 to 30 vehicles passing through in a day,” he says. With a high price tag for replacing and upgrading highways, Neubauer adds, it is difficult to prioritize the upkeep of low-traffic bridges over busier state highways.
Though the Federal Highway Administration collects the inspection records at a federal level, it is ultimately up to the state to make sure that its bridges are in good health. “We are doing the best we can with the funds we have,” Neubauer says.
The data from three territories—Guam, Puerto Rico and the U.S. Virgin Islands—were available but not initially included in Scientific American’s top 10 list. If they were included, however, several counties in Puerto Rico would surpass Iowa and Alaska. The island suffered a series of devastating natural disasters in recent years, resulting in the destruction of many bridges and roads.
Diana G. Ramirez-Rios, an assistant professor at the University at Buffalo, whose research includes transportation access issues in Puerto Rico, says that the island has yet to recover from the disastrous impacts of Hurricanes Irma and Maria in 2017. Many of the temporary, replacement bridges that were built after 2017 failed again later as a result of another hurricane. “The priority is to ensure communities are well-connected with permanent infrastructure solutions,” she says.
Denial of responsibility! Techno Blender is an automatic aggregator of the all world’s media. In each content, the hyperlink to the primary source is specified. All trademarks belong to their rightful owners, all materials to their authors. If you are the owner of the content and do not want us to publish your materials, please contact us by email – [email protected]. The content will be deleted within 24 hours.