
Data Science for Sustainable Sourcing
How can you use Data Science to select the best suppliers considering indicators for sustainability and social indicators?
Sustainable sourcing is the process of integrating social, ethical and environmental performance factors when selecting suppliers.
This includes assessing and evaluating suppliers based on sustainability criteria such as health and safety, environmental impacts or labour rights.
The aim is to minimize the negative impacts on the environment and maximize the positive social impacts.
As a Data Science Manager, can you develop tools to streamline the process of supplier selection?
Supply Chain Network design tools automatically select the best suppliers that minimize costs and meet the market demand while respecting constraints defined by your sustainability team.
In this article, we will explore how you can use data science in your organization to support the implementation of sustainable sourcing.
Sustainable Sourcing Problem Statement
Scenario: Selection of T-shirts Suppliers
Let us take the example used in the previous articles about Life Cycle Assessment.
You are the Data Science Manager of an international clothing group that has stores all around the world.
The company sources garments, bags, and accessories from suppliers located in Asia.
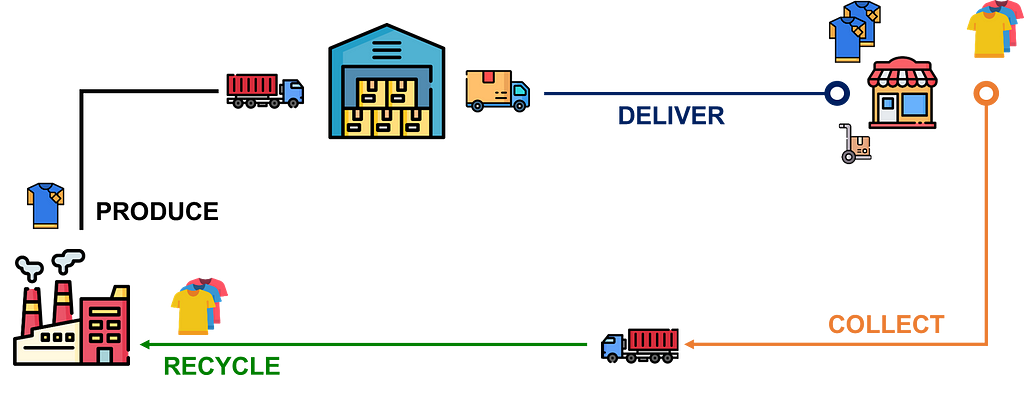
Stores are delivered from local warehouses that are directly replenished by suppliers.
Can you automatically select suppliers that minimize your costs while respecting environmental and social constraints?
The sourcing team has decided to implement sustainable sourcing on the limited scope of T-shirt suppliers.
They want to review their supplier selection process to support the company’s sustainability roadmap.
However, they are facing several obstacles
- Suppliers data collection and storage
There is no central source of information as the data is stored in unstructured Excel files across the organization. - Complex decision-making based on many parameters
Their current system of Excel Scorecard is showing its limits as the number of indicators is increasing.
Therefore, they request your help deploying a product to monitor suppliers’ KPIs and automate the selection.
Let’s see how data analytics can answer this problem.
Sustainable Sourcing Indicators
I will use a simple example with a limited range of indicators for this article.
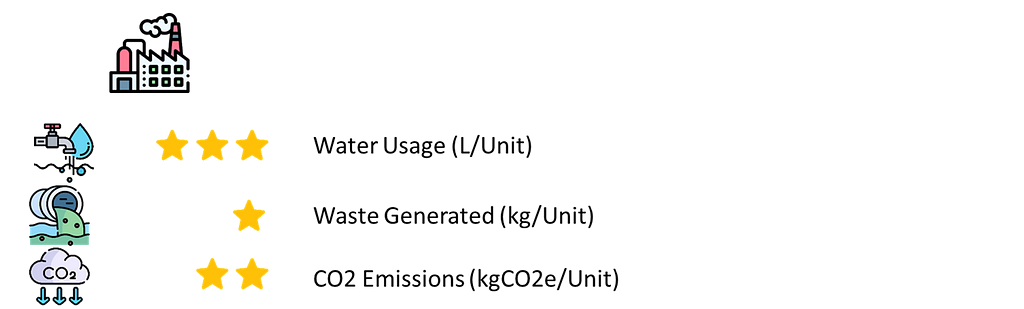
- Environmental Indicators including Carbon Emissions, Energy Consumption, Waste Generation and Water Usage
- Social Indicators, including labour and human rights
We can quickly review them to understand their definition and how to measure them.
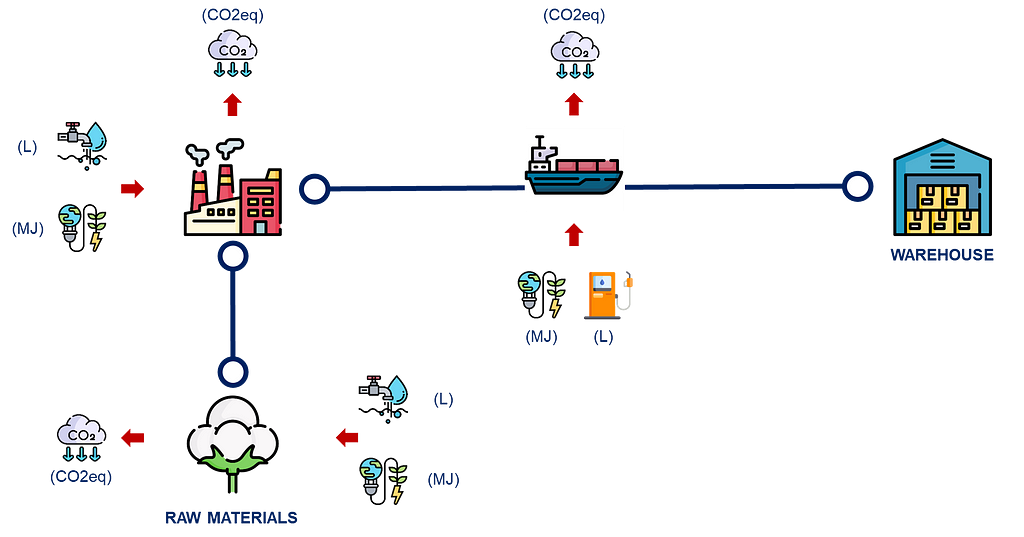
Carbon emissions
The primary indicator that will drive your sustainability roadmap is the carbon footprint of the supply chain.
This can be measured by calculating the total emissions of greenhouse gases such as carbon dioxide, methane and nitrous oxide.
💡 What should we consider?
- Emissions during the cultivation of the cotton used for your t-shirts
- Emissions from electricity generation and chemicals used for t-shirt production
- Transportation of the finished goods (t-shirt) from the factory to the central distribution centre by sea freight
The first two metrics should be collected from the suppliers, but your team can calculate the third one.
The formula is quite straightforward

With,
E_CO2: emissions in kilograms of CO2 equivalent (kgCO2eq)
W_goods: weight of the goods (Ton)
D: distance from your warehouse to the final destination(km)
F_mode: emissions factor for each transportation mode (kgCO2eq/t.km)
The data sources are
- Transportation Management System databases with shipments including (dates, source, destination, shipment quantity)
- Master Data to convert shipment quantities into weight
If you need more information, I have detailed the process in this article
Supply Chain Sustainability Reporting with Python
Energy consumption
Another indicator is the amount of energy consumed by the supplier to produce and deliver products.
It can be expressed in Joules used per production unit (called functional units in the Life Cycle Assessment Methodology).
💡 What should we consider?
- Energy consumption for cotton cultivation (kJ)
- Energy consumption for spinning, weaving and dying (kJ)
- Energy consumption for transportation (kJ)
The sourcing team should collect this metric.
Water usage
As it becomes a scarce resource, new regulations are pushing companies to redesign their processes for water consumption reduction.
With this indicator, you can focus on suppliers that do not affect the local water supply.
💡 What should we consider?
- Water consumption for cotton cultivation (L/Unit)
- Water consumption for spinning, weaving and dying (L/Unit)
Waste generation
Measuring the amount of waste generated during production can help identify areas for adopting more sustainable production methods.
💡 What should we consider?
- Solid waste generation during production (kg/Unit)
Social indicators
These indicators assess suppliers’ performance in terms of social sustainability.
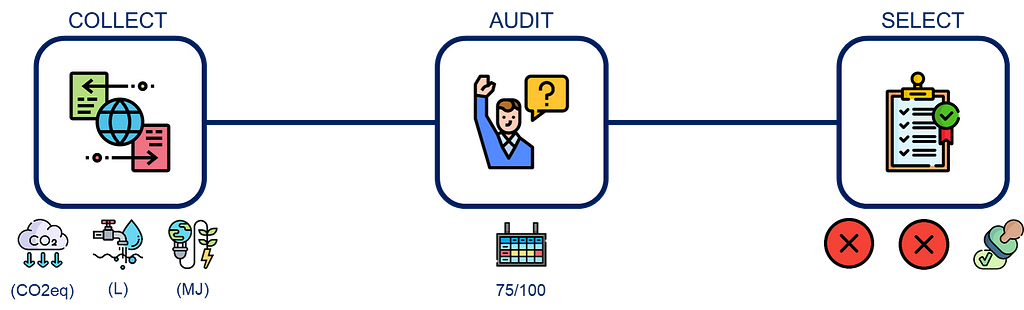
You can conduct your own audits or use third-party assessments.
💡 How to Measure it?
Your sourcing team assigns a weight to each criterion in the scorecard below.
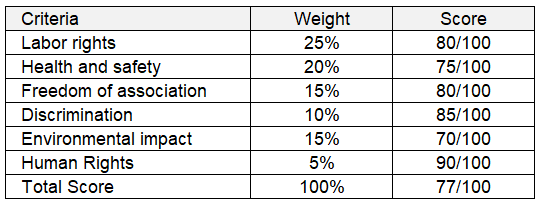
The auditors calculate a score linked to each criterion to represent the supplier’s performance.
The total score is a pondered average of the scores that provide a general supplier assessment.
How do we organize data collection and storage?
The first support you can provide to your sourcing team is to streamline the data collection and storage process using data analytics tools.
A data lake can be a central source of unstructured and structured data (databases, excel files, …).
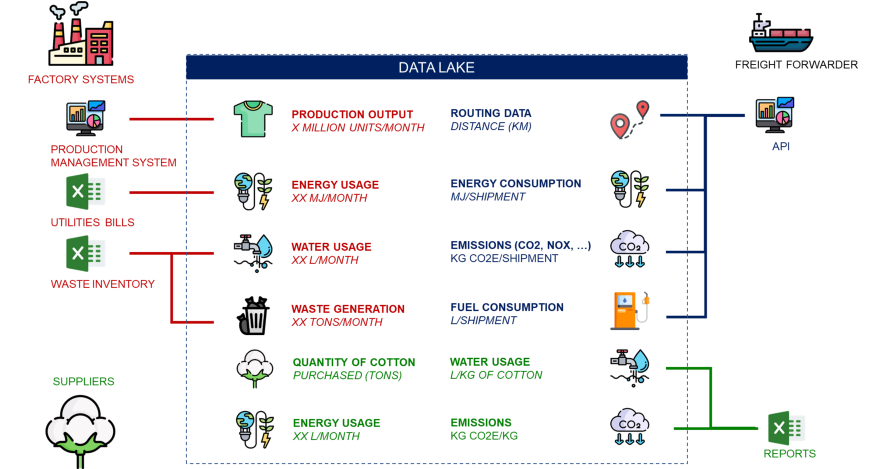
You can implement automated pipelines to extract, process and analyze these data to build reports and provide insights.
This can lead to the implementation of data products that can be used for reporting and the optimization models I will present in the next section.
For more information on the best practices and methodologies to automate this exercise, look at this article about Life Cycle Assessment.
What is a Life Cycle Assessment? LCA
Sourcing Network Design
We can use this data to drive decisions now that we have collected information about suppliers and performed audits with scoring.
The sourcing team’s main obstacle was the problem’s complexity considering the number of different metrics and suppliers.
They use Excel files with limited automation; this restrains their processing capacity.
Therefore, the idea is to use advanced analytics to automatically design sourcing and logistics networks to deliver your stores.
I will use an example with dummy data to understand how to implement a data-driven methodology to select suppliers considering environmental factors.
Problem Statement
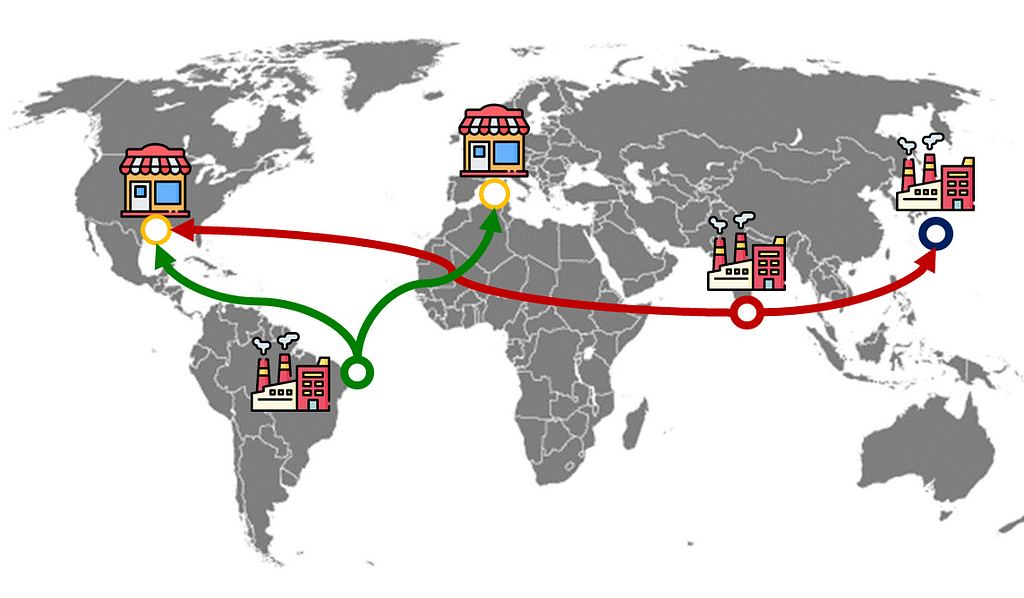
You want to redefine the Supply Chain Network of your fast fashion retail company for the next five years.
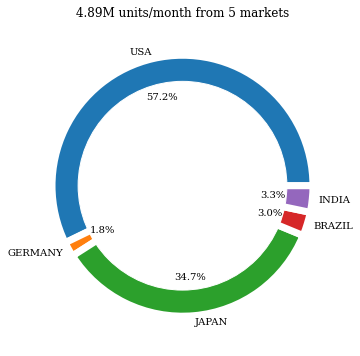
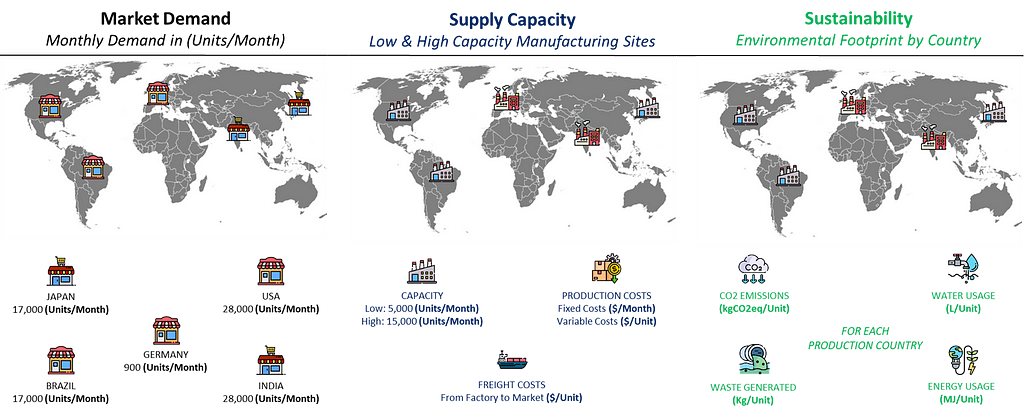
You have stores in 5 different markets worldwide (USA, Germany, Japan, India and Brazil).
In each market, you can select a supplier to produce your t-shirts and choose to source from abroad.
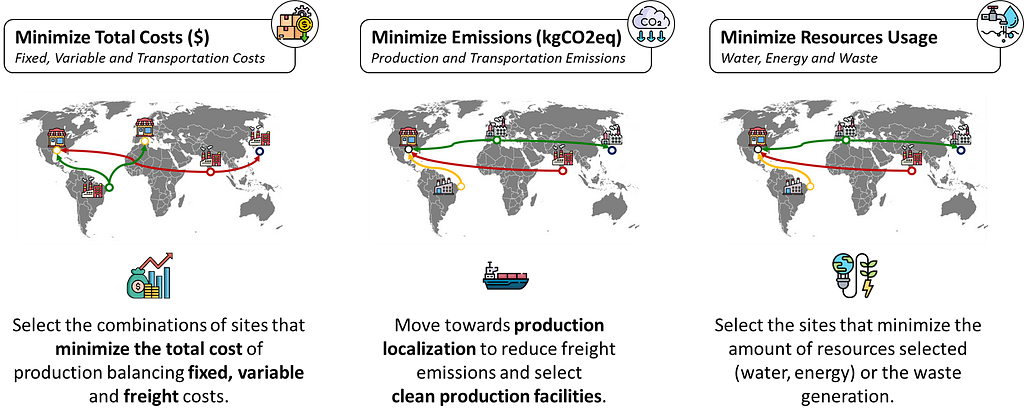
You would like to select the right set of suppliers to minimize the cost of production and delivery considering.
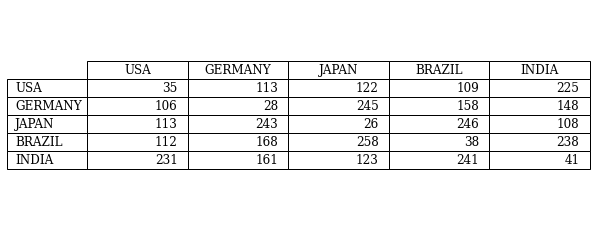
- The demand of each market (MUnits/Month)
- Fixed and variable costs of production in each country ($)
- Transportation costs from the factory to the market by sea freight ($/Unit)
Your overseas suppliers are cheaper, but you must pay high freight costs to deliver to your market with higher CO2 emissions for transportation.
Moreover, the sustainability team has implemented constraints on maximum environmental impact per T-shirt produced including water usage, CO2 emissions, energy usage and waste generated.
The sourcing team needs linear programming support to manage these complex tradeoffs and decide which suppliers to select.
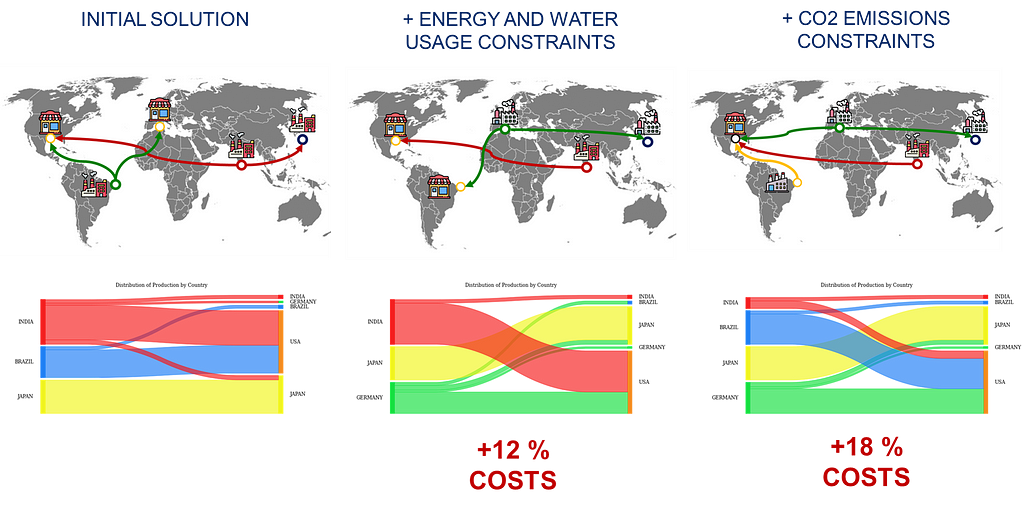
Let me illustrate my point with the example below, in which I will gradually add environmental constraints to see the impact on the footprint.
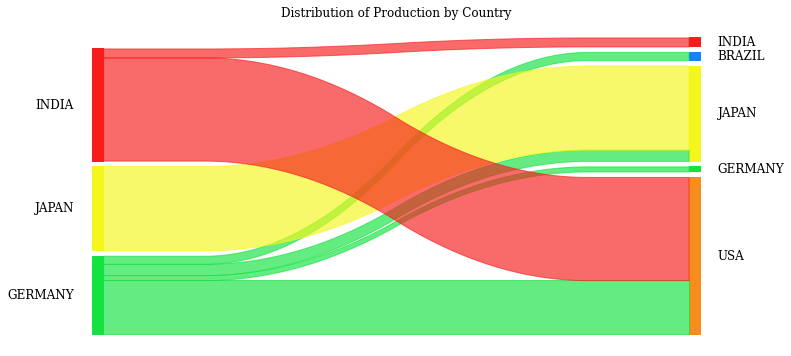
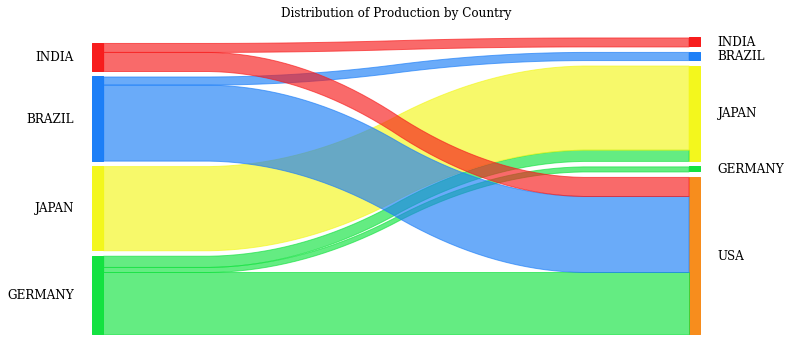
Initial Solution: Minimize Costs
If you define the objective function to minimize the costs without additional constraints, you can easily guess that it will maximize the volume produced in India and Brazil.
💡 Insights
- In this case, the increased freight costs of sourcing overseas are compensated by the low production costs of India and Brazil.
What if we want to add sustainability constraints?
Implement Sustainable Sourcing Constraints
As your company implements a sustainability roadmap, you must add additional constraints limiting the environmental impact per T-shirt produced and delivered.
Therefore, your procurement team has contacted local suppliers in your predominant markets (USA, Japan).
What would be the impact on your sourcing network?
Test 1: Energy and Water Savings Constraints
We can start by adding constraints on the average energy and water consumption per unit produced.
- Average water consumption below 3000 L/Unit
- Average energy usage below 685 MJ/Unit
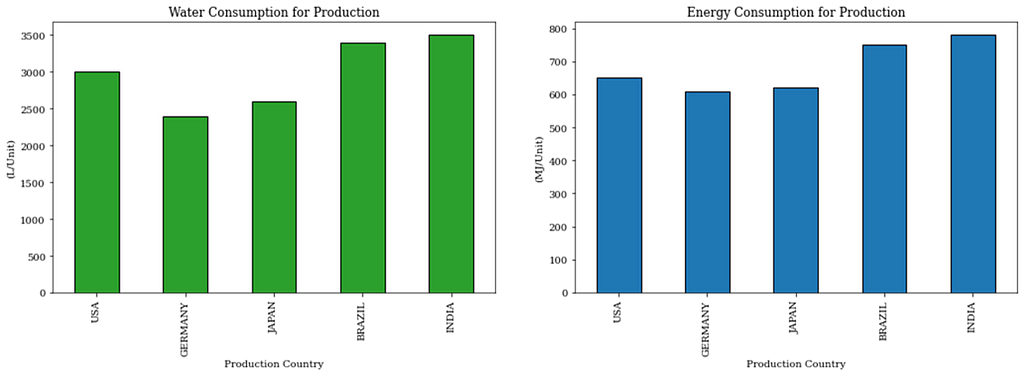
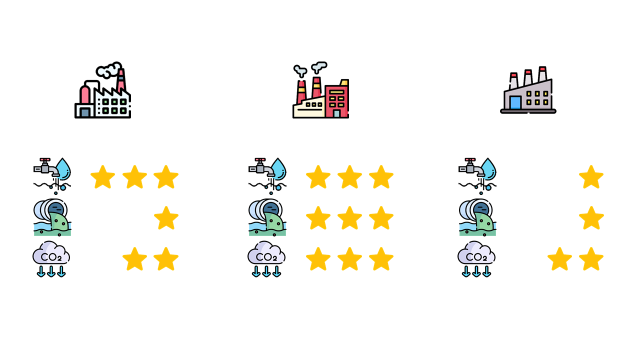
Your suppliers in Germany and Japan heavily invested in modern equipment to reduce the environmental impact of their operations.
💡 Insights
- The model switched production from flow Brazil to Germany to respect the additional constraints.
- The model decided to keep producing in India because of the competitive costs.
- Germany and Japan are now localizing their production.
What if we add CO2 emissions constraints?
Test 2: Add CO2 Emissions Constraints
Transportation accounts for a considerable part of the CO2 footprint of your Supply Chain.
Therefore, you would like to reduce the impact of upstream flows by limiting the CO2 emissions of
- Cultivation and Production per unit kg CO2e/Unit
- Transportation by sea freight kg CO2e/Unit
- Total Emissions must be below 110 kg CO2e/Unit
💡 Insights
- For the first time, India has the lowest production output.
- Brazil is a solution to keep manufacturing costs low while limiting CO2 emissions.
- USA suppliers have not invested enough in sustainable production facilities to be retained for the domestic market supply.
With this simple exercise, you can get the potential of these solutions to accelerate the decision-making process by testing several scenarios.
If you want to try it yourself, I have deployed this solution in a web application hosted on the VIKTOR platform.
You can upload your dataset or use the sample available in the app to test different scenarios.
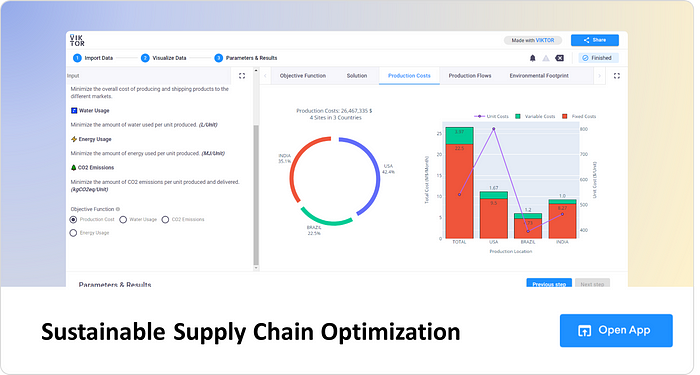
For more details about this solution, have a look at this article published on Towards Data Science.
Create a Sustainable Supply Chain Optimization Web App
Conclusion
When implementing a green transformation, companies face many challenges related to change management and complex decision-making processes.
As a data analytics professional, you can support this transformation by facilitating data collection and partially automating decision-making using optimization models.
Sourcing teams can easily add constraints in their supplier selection process to follow the guidance of the sustainability team.
By showing the financial impact of each scenario, you facilitate the decision-making process by highlighting the balance between sustainability and cost efficiency.
These results can trigger strategic discussions to find the right balance between sustainable sourcing and cost reduction.
About Me
Let’s connect on Linkedin and Twitter; I am a Supply Chain Engineer using data analytics to improve logistics operations and reduce costs.
If interested in Data Analytics and Supply Chain, look at my website.
Samir Saci | Data Science & Productivity
💡 Follow me on Medium for more articles related to 🏭 Supply Chain Analytics, 🌳 Sustainability and 🕜 Productivity.
Data Science for Sustainable Sourcing was originally published in Towards Data Science on Medium, where people are continuing the conversation by highlighting and responding to this story.
How can you use Data Science to select the best suppliers considering indicators for sustainability and social indicators?
Sustainable sourcing is the process of integrating social, ethical and environmental performance factors when selecting suppliers.
This includes assessing and evaluating suppliers based on sustainability criteria such as health and safety, environmental impacts or labour rights.
The aim is to minimize the negative impacts on the environment and maximize the positive social impacts.
As a Data Science Manager, can you develop tools to streamline the process of supplier selection?
Supply Chain Network design tools automatically select the best suppliers that minimize costs and meet the market demand while respecting constraints defined by your sustainability team.
In this article, we will explore how you can use data science in your organization to support the implementation of sustainable sourcing.
Sustainable Sourcing Problem Statement
Scenario: Selection of T-shirts Suppliers
Let us take the example used in the previous articles about Life Cycle Assessment.
You are the Data Science Manager of an international clothing group that has stores all around the world.
The company sources garments, bags, and accessories from suppliers located in Asia.
Stores are delivered from local warehouses that are directly replenished by suppliers.
Can you automatically select suppliers that minimize your costs while respecting environmental and social constraints?
The sourcing team has decided to implement sustainable sourcing on the limited scope of T-shirt suppliers.
They want to review their supplier selection process to support the company’s sustainability roadmap.
However, they are facing several obstacles
- Suppliers data collection and storage
There is no central source of information as the data is stored in unstructured Excel files across the organization. - Complex decision-making based on many parameters
Their current system of Excel Scorecard is showing its limits as the number of indicators is increasing.
Therefore, they request your help deploying a product to monitor suppliers’ KPIs and automate the selection.
Let’s see how data analytics can answer this problem.
Sustainable Sourcing Indicators
I will use a simple example with a limited range of indicators for this article.
- Environmental Indicators including Carbon Emissions, Energy Consumption, Waste Generation and Water Usage
- Social Indicators, including labour and human rights
We can quickly review them to understand their definition and how to measure them.
Carbon emissions
The primary indicator that will drive your sustainability roadmap is the carbon footprint of the supply chain.
This can be measured by calculating the total emissions of greenhouse gases such as carbon dioxide, methane and nitrous oxide.
💡 What should we consider?
- Emissions during the cultivation of the cotton used for your t-shirts
- Emissions from electricity generation and chemicals used for t-shirt production
- Transportation of the finished goods (t-shirt) from the factory to the central distribution centre by sea freight
The first two metrics should be collected from the suppliers, but your team can calculate the third one.
The formula is quite straightforward
With,
E_CO2: emissions in kilograms of CO2 equivalent (kgCO2eq)
W_goods: weight of the goods (Ton)
D: distance from your warehouse to the final destination(km)
F_mode: emissions factor for each transportation mode (kgCO2eq/t.km)
The data sources are
- Transportation Management System databases with shipments including (dates, source, destination, shipment quantity)
- Master Data to convert shipment quantities into weight
If you need more information, I have detailed the process in this article
Supply Chain Sustainability Reporting with Python
Energy consumption
Another indicator is the amount of energy consumed by the supplier to produce and deliver products.
It can be expressed in Joules used per production unit (called functional units in the Life Cycle Assessment Methodology).
💡 What should we consider?
- Energy consumption for cotton cultivation (kJ)
- Energy consumption for spinning, weaving and dying (kJ)
- Energy consumption for transportation (kJ)
The sourcing team should collect this metric.
Water usage
As it becomes a scarce resource, new regulations are pushing companies to redesign their processes for water consumption reduction.
With this indicator, you can focus on suppliers that do not affect the local water supply.
💡 What should we consider?
- Water consumption for cotton cultivation (L/Unit)
- Water consumption for spinning, weaving and dying (L/Unit)
Waste generation
Measuring the amount of waste generated during production can help identify areas for adopting more sustainable production methods.
💡 What should we consider?
- Solid waste generation during production (kg/Unit)
Social indicators
These indicators assess suppliers’ performance in terms of social sustainability.
You can conduct your own audits or use third-party assessments.
💡 How to Measure it?
Your sourcing team assigns a weight to each criterion in the scorecard below.
The auditors calculate a score linked to each criterion to represent the supplier’s performance.
The total score is a pondered average of the scores that provide a general supplier assessment.
How do we organize data collection and storage?
The first support you can provide to your sourcing team is to streamline the data collection and storage process using data analytics tools.
A data lake can be a central source of unstructured and structured data (databases, excel files, …).
You can implement automated pipelines to extract, process and analyze these data to build reports and provide insights.
This can lead to the implementation of data products that can be used for reporting and the optimization models I will present in the next section.
For more information on the best practices and methodologies to automate this exercise, look at this article about Life Cycle Assessment.
What is a Life Cycle Assessment? LCA
Sourcing Network Design
We can use this data to drive decisions now that we have collected information about suppliers and performed audits with scoring.
The sourcing team’s main obstacle was the problem’s complexity considering the number of different metrics and suppliers.
They use Excel files with limited automation; this restrains their processing capacity.
Therefore, the idea is to use advanced analytics to automatically design sourcing and logistics networks to deliver your stores.
I will use an example with dummy data to understand how to implement a data-driven methodology to select suppliers considering environmental factors.
Problem Statement
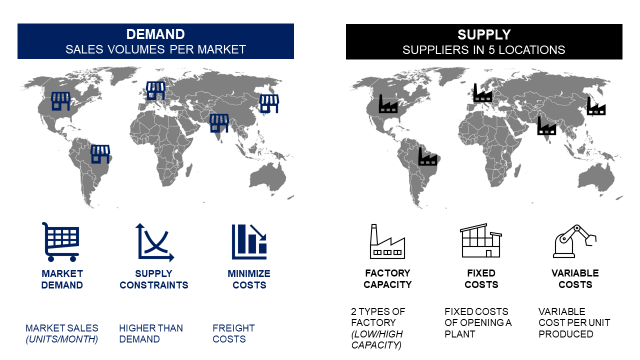
You want to redefine the Supply Chain Network of your fast fashion retail company for the next five years.
You have stores in 5 different markets worldwide (USA, Germany, Japan, India and Brazil).
In each market, you can select a supplier to produce your t-shirts and choose to source from abroad.
You would like to select the right set of suppliers to minimize the cost of production and delivery considering.
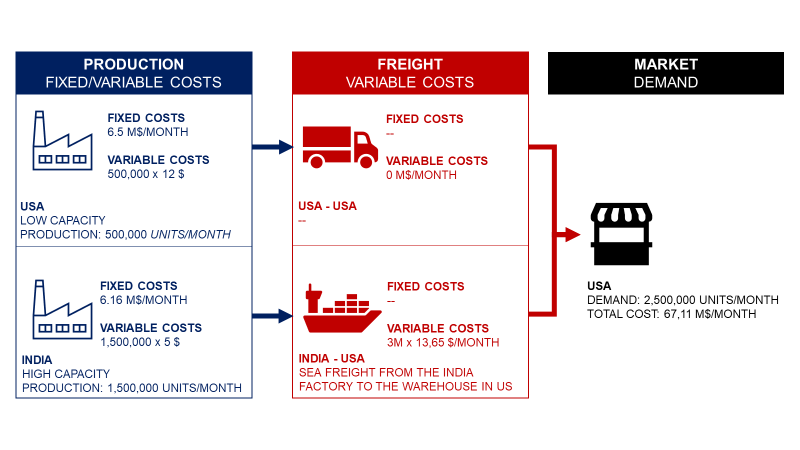
- The demand of each market (MUnits/Month)
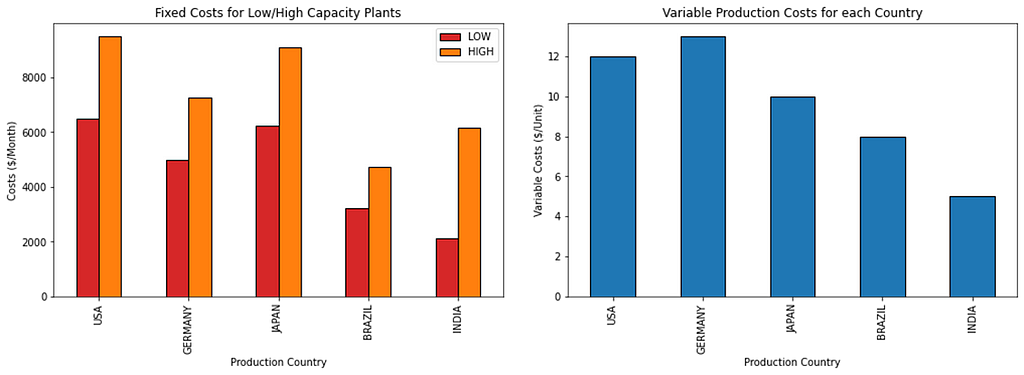
- Fixed and variable costs of production in each country ($)
- Transportation costs from the factory to the market by sea freight ($/Unit)
Your overseas suppliers are cheaper, but you must pay high freight costs to deliver to your market with higher CO2 emissions for transportation.
Moreover, the sustainability team has implemented constraints on maximum environmental impact per T-shirt produced including water usage, CO2 emissions, energy usage and waste generated.
The sourcing team needs linear programming support to manage these complex tradeoffs and decide which suppliers to select.
Let me illustrate my point with the example below, in which I will gradually add environmental constraints to see the impact on the footprint.
Initial Solution: Minimize Costs
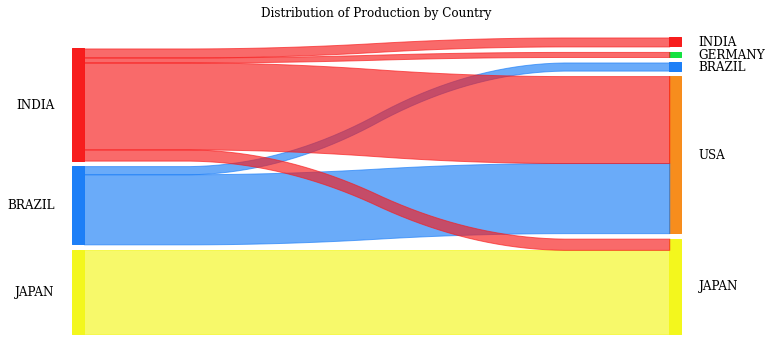
If you define the objective function to minimize the costs without additional constraints, you can easily guess that it will maximize the volume produced in India and Brazil.
💡 Insights
- In this case, the increased freight costs of sourcing overseas are compensated by the low production costs of India and Brazil.
What if we want to add sustainability constraints?
Implement Sustainable Sourcing Constraints
As your company implements a sustainability roadmap, you must add additional constraints limiting the environmental impact per T-shirt produced and delivered.
Therefore, your procurement team has contacted local suppliers in your predominant markets (USA, Japan).
What would be the impact on your sourcing network?
Test 1: Energy and Water Savings Constraints
We can start by adding constraints on the average energy and water consumption per unit produced.
- Average water consumption below 3000 L/Unit
- Average energy usage below 685 MJ/Unit
Your suppliers in Germany and Japan heavily invested in modern equipment to reduce the environmental impact of their operations.
💡 Insights
- The model switched production from flow Brazil to Germany to respect the additional constraints.
- The model decided to keep producing in India because of the competitive costs.
- Germany and Japan are now localizing their production.
What if we add CO2 emissions constraints?
Test 2: Add CO2 Emissions Constraints
Transportation accounts for a considerable part of the CO2 footprint of your Supply Chain.
Therefore, you would like to reduce the impact of upstream flows by limiting the CO2 emissions of
- Cultivation and Production per unit kg CO2e/Unit
- Transportation by sea freight kg CO2e/Unit
- Total Emissions must be below 110 kg CO2e/Unit
💡 Insights
- For the first time, India has the lowest production output.
- Brazil is a solution to keep manufacturing costs low while limiting CO2 emissions.
- USA suppliers have not invested enough in sustainable production facilities to be retained for the domestic market supply.
With this simple exercise, you can get the potential of these solutions to accelerate the decision-making process by testing several scenarios.
If you want to try it yourself, I have deployed this solution in a web application hosted on the VIKTOR platform.
You can upload your dataset or use the sample available in the app to test different scenarios.
For more details about this solution, have a look at this article published on Towards Data Science.
Create a Sustainable Supply Chain Optimization Web App
Conclusion
When implementing a green transformation, companies face many challenges related to change management and complex decision-making processes.
As a data analytics professional, you can support this transformation by facilitating data collection and partially automating decision-making using optimization models.
Sourcing teams can easily add constraints in their supplier selection process to follow the guidance of the sustainability team.
By showing the financial impact of each scenario, you facilitate the decision-making process by highlighting the balance between sustainability and cost efficiency.
These results can trigger strategic discussions to find the right balance between sustainable sourcing and cost reduction.
About Me
Let’s connect on Linkedin and Twitter; I am a Supply Chain Engineer using data analytics to improve logistics operations and reduce costs.
If interested in Data Analytics and Supply Chain, look at my website.
Samir Saci | Data Science & Productivity
💡 Follow me on Medium for more articles related to 🏭 Supply Chain Analytics, 🌳 Sustainability and 🕜 Productivity.
Data Science for Sustainable Sourcing was originally published in Towards Data Science on Medium, where people are continuing the conversation by highlighting and responding to this story.
Denial of responsibility! Techno Blender is an automatic aggregator of the all world’s media. In each content, the hyperlink to the primary source is specified. All trademarks belong to their rightful owners, all materials to their authors. If you are the owner of the content and do not want us to publish your materials, please contact us by email – [email protected]. The content will be deleted within 24 hours.