
Forecasting Uncertainty with Linear Models like in Deep Learning | by Marco Cerliani | Sep, 2022
Incorporate into Prediction Intervals both Aleatoric and Epistemic Uncertainties
Usually, applications in the machine learning industry don’t consider how to produce uncertainty estimates. In many real-world tasks, it’s not only required to make accurate predictions. Providing a confidence score on the model outcomes may be crucial to making the most effective decisions.
Except for some deep learning techniques or other special cases, producing confidence estimates is not a free lunch. We can think about all the solutions that produce confidence scores as a separate step from the standard training and predicting phases. The most simple and intuitive approach consists in using bootstrapping on the residuals as a way to estimate uncertainty between observed values and predictions. Bootstrap-based techniques are a starting point when approaching the field of uncertainty.
Using bootstrapping, we can build a confidence measure for our forecasts with low effort and simple assumptions. On the other side, producing reliable and calibrated estimations may require a little bit more attention and validation than using blindly the bootstrap rules.
As a first thing to remember, we don’t want to optimize a predictive model to produce the best point-wise forecasts. Having accurate predictions it’s desirable but providing reliable bounds, in which we are confident the observed values fall, would be fantastic. In other words, having good predictions is a starting point, but building confidence estimates is most of the time a separate task that should be validated using proper scoring measures.
Secondly, we should remember the presence of two different uncertainty sources. We are respectively referring to aleatoric and epistemic uncertainties. What it’s certain is that all AI predictions are always uncertain. For this reason, a good confidence measure should encompass both aleatoric and epistemic uncertainties.
In this post, we introduce a way to provide confidence estimates for our machine learning models in regression tasks. The proposed method simply works as an add-on step, coming after forecasting. It fits a separate linear model to produce exclusively predictions for sample-wise uncertainty by minimizing an ‘ad-hoc’ loss function. To have a more technical overview of the topic, I suggest this paper which this post proposed to be a generalization applicable also outside the neural network’s ecosystem.
The prerequisite of the proposed solution can be summarized in two general concepts:
- Adaptability: our solution should be applicable at the end of every forecasting solution as an additional step in the flow.
- Completeness: the method should be good enough to cover both aleatoric and epistemic uncertainty scenarios.
As a starting point, we have to obtain an empirical representation to numerical estimate the variance of a predictive model. In this sense, the Gaussian Negative Log-Likelihood (NLL) loss is a perfect candidate.

In the above loss, there are mainly 3 terms involved:
- yᵢ: the target values that we use also to build our predictive model.
- μ(xᵢ): the point-wise predictions made by a forecasting model.
- σ(xᵢ): the estimation’s uncertainty that represents exactly what we want to predict.
To provide a sample-wise estimation of uncertainty we consider as given both yᵢ and μ(xᵢ). This means that we have already fitted a predictive model of our choice. To minimize the NLL loss we fit a linear model which tries to predict the optimal values for σ(xᵢ). At the end of the minimization, we have a linear model which receives as input the features at our disposal and returns the uncertainty predictions for each observation.
Let’s see the proposed methodology in action.
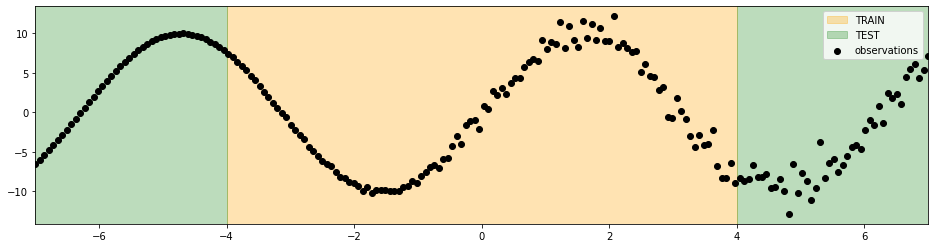
We generate sinusoidal data in a fixed domain with increasing gaussian noise in one direction. We explicitly chose this data to see what a model could predict outside its domain of knowledge. Despite the data is quite simple, we don’t expect our model to generalize well outside the train boundaries.
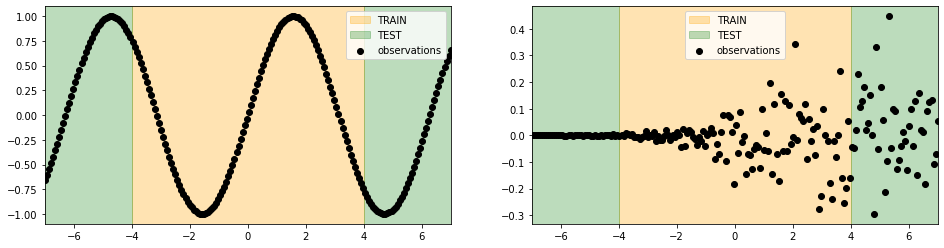
On the other side, our uncertainty estimations should outline the difficulties of our model to make predictions outside its domain of knowledge.
In the below figure, we depict the uncertainty obtained, with the proposed methodology, using the predictions of a multi-layer perceptron regressor. The width of the generated sigma intervals grows with the increase of the noise in the data. That’s correct and means that we can catch the noise present in the data as a form of uncertainty (aleatoric uncertainty).
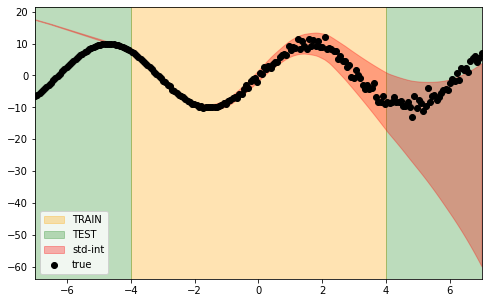
As a further step, we would like to see if we can incorporate, as an additional source of uncertainty, the inaccuracy of the model predictions’ (epistemic uncertainty). In this sense, we would expect to see the confidence bands growing in both directions outside the training boundaries since the model is not fitted to predict data outside this range.

In the above figure, we observe exactly what we are aiming to obtain. Our sigma intervals encapsulate uncertainties coming from data and the model’s outcome simultaneously. We obtained this result simply by applying our methodology in an ensemble format. In other words, we fit multiple multi-layer perceptron regressors and combine them to build a gaussian mixture. Respectively, the mean and the standard deviation of the mixture are returned as forecasts for the real values and uncertainties.
A closer look at the sigma predictions, from both methodologies, is useful to mark the differences in how the two uncertainty sources are taken into account.

In this post, we introduced a methodology to estimate model uncertainties. We provided a fancy and tricky implementation that consists in fitting a linear regression to predict the standard deviation of each point-wise prediction. We discovered also how to incorporate both aleatoric and epistemic sources into our confidence predictions. As an added value, the proposed implementation seems to apply to all the models having built-in extrapolation capabilities.
Incorporate into Prediction Intervals both Aleatoric and Epistemic Uncertainties
Usually, applications in the machine learning industry don’t consider how to produce uncertainty estimates. In many real-world tasks, it’s not only required to make accurate predictions. Providing a confidence score on the model outcomes may be crucial to making the most effective decisions.
Except for some deep learning techniques or other special cases, producing confidence estimates is not a free lunch. We can think about all the solutions that produce confidence scores as a separate step from the standard training and predicting phases. The most simple and intuitive approach consists in using bootstrapping on the residuals as a way to estimate uncertainty between observed values and predictions. Bootstrap-based techniques are a starting point when approaching the field of uncertainty.
Using bootstrapping, we can build a confidence measure for our forecasts with low effort and simple assumptions. On the other side, producing reliable and calibrated estimations may require a little bit more attention and validation than using blindly the bootstrap rules.
As a first thing to remember, we don’t want to optimize a predictive model to produce the best point-wise forecasts. Having accurate predictions it’s desirable but providing reliable bounds, in which we are confident the observed values fall, would be fantastic. In other words, having good predictions is a starting point, but building confidence estimates is most of the time a separate task that should be validated using proper scoring measures.
Secondly, we should remember the presence of two different uncertainty sources. We are respectively referring to aleatoric and epistemic uncertainties. What it’s certain is that all AI predictions are always uncertain. For this reason, a good confidence measure should encompass both aleatoric and epistemic uncertainties.
In this post, we introduce a way to provide confidence estimates for our machine learning models in regression tasks. The proposed method simply works as an add-on step, coming after forecasting. It fits a separate linear model to produce exclusively predictions for sample-wise uncertainty by minimizing an ‘ad-hoc’ loss function. To have a more technical overview of the topic, I suggest this paper which this post proposed to be a generalization applicable also outside the neural network’s ecosystem.
The prerequisite of the proposed solution can be summarized in two general concepts:
- Adaptability: our solution should be applicable at the end of every forecasting solution as an additional step in the flow.
- Completeness: the method should be good enough to cover both aleatoric and epistemic uncertainty scenarios.
As a starting point, we have to obtain an empirical representation to numerical estimate the variance of a predictive model. In this sense, the Gaussian Negative Log-Likelihood (NLL) loss is a perfect candidate.
In the above loss, there are mainly 3 terms involved:
- yᵢ: the target values that we use also to build our predictive model.
- μ(xᵢ): the point-wise predictions made by a forecasting model.
- σ(xᵢ): the estimation’s uncertainty that represents exactly what we want to predict.
To provide a sample-wise estimation of uncertainty we consider as given both yᵢ and μ(xᵢ). This means that we have already fitted a predictive model of our choice. To minimize the NLL loss we fit a linear model which tries to predict the optimal values for σ(xᵢ). At the end of the minimization, we have a linear model which receives as input the features at our disposal and returns the uncertainty predictions for each observation.
Let’s see the proposed methodology in action.
We generate sinusoidal data in a fixed domain with increasing gaussian noise in one direction. We explicitly chose this data to see what a model could predict outside its domain of knowledge. Despite the data is quite simple, we don’t expect our model to generalize well outside the train boundaries.
On the other side, our uncertainty estimations should outline the difficulties of our model to make predictions outside its domain of knowledge.
In the below figure, we depict the uncertainty obtained, with the proposed methodology, using the predictions of a multi-layer perceptron regressor. The width of the generated sigma intervals grows with the increase of the noise in the data. That’s correct and means that we can catch the noise present in the data as a form of uncertainty (aleatoric uncertainty).
As a further step, we would like to see if we can incorporate, as an additional source of uncertainty, the inaccuracy of the model predictions’ (epistemic uncertainty). In this sense, we would expect to see the confidence bands growing in both directions outside the training boundaries since the model is not fitted to predict data outside this range.
In the above figure, we observe exactly what we are aiming to obtain. Our sigma intervals encapsulate uncertainties coming from data and the model’s outcome simultaneously. We obtained this result simply by applying our methodology in an ensemble format. In other words, we fit multiple multi-layer perceptron regressors and combine them to build a gaussian mixture. Respectively, the mean and the standard deviation of the mixture are returned as forecasts for the real values and uncertainties.
A closer look at the sigma predictions, from both methodologies, is useful to mark the differences in how the two uncertainty sources are taken into account.
In this post, we introduced a methodology to estimate model uncertainties. We provided a fancy and tricky implementation that consists in fitting a linear regression to predict the standard deviation of each point-wise prediction. We discovered also how to incorporate both aleatoric and epistemic sources into our confidence predictions. As an added value, the proposed implementation seems to apply to all the models having built-in extrapolation capabilities.
Denial of responsibility! Techno Blender is an automatic aggregator of the all world’s media. In each content, the hyperlink to the primary source is specified. All trademarks belong to their rightful owners, all materials to their authors. If you are the owner of the content and do not want us to publish your materials, please contact us by email – [email protected]. The content will be deleted within 24 hours.